Analytics is the measurement layer underneath every other marketing channel — for the broader strategy this measurement supports, see our digital marketing strategy guide.
The Definitive Website Analytics Strategy Guide
World Map: What are Web Analytics?
When digital marketing started, it promised to do something that traditional marketers couldn’t do:
Understand how their efforts helped the business’ bottom line.
I’m sure you’ve heard the phrase: “Half the money I spend on advertising is wasted; the trouble is I don’t know which half.”
That was going to change.
Digital marketers had access to an unprecedented amount of data, which allowed them to know exactly which of their campaigns did and didn’t work.
This new type of analytical marketer was trained to use data to make better business decisions.
Except this didn’t really happen.
It’s true that digital marketers use more data than what was traditionally available…
…but when it comes to understanding the bigger picture, analytics can make your head spin.

I say this from experience—I was completely clueless for longer than I care to admit.
The problem is that a lot of digital marketers don’t really understand web analytics marketing strategies.
Web analytics is the process of tracking, understanding, and making data-driven decisions that generate business growth.
If you’re not doing those three things (track, understand, and act), you’ve only scratched the surface of what you can achieve as a digital marketer.
This guide will teach you EXACTLY how to do this, even if you have zero web analytics experience.
Strategy: How to Create a Powerful Web Analytics Strategy

I don’t know about you, but the first time I opened up Google Analytics, I was terrified.
It’s intimidating!
I thought I was going to have all the data I needed to make sense of what was going on in my business…
…but things didn’t work out like I thought they would.
Expectation: At my fingertips, I was going to have data to understand exactly who my website visitors were, where they were coming from, and what they were doing on my site.
Reality: I curled up into a ball, cried, and didn’t open Google Analytics again for several months.
For the longest time, I had web analytics PTSD.
The thing is that there is SO MUCH data in Google Analytics, I didn’t know where to get started.
I would go into Google Analytics rabbit holes trying to make sense of what was going on and come out several hours later feeling like I hadn’t learned a single thing.
After talking to dozens of digital marketers, I’ve learned I wasn’t the only one with this problem.
The biggest challenge with web analytics is getting past the overwhelm that blocks you from extracting insights from your data and making decisions that grow your business.
Fortunately, there is a solution:
Instead of trying to track and make sense of hundreds of metrics at the same time, you can get massive results for your business by relentlessly focusing on 5 or fewer metrics.
If you’re just getting started, you can do this by following this framework:
- Learn how web analytics tracking fundamentally works
- Understand the AABC of analytics
- Create a measurement plan
- Implement the measurement plan
Let’s dig into each of these next.
Understand How Web Analytics Tracking Works
Many digital marketers make the mistake of jumping into web analytics without understanding how website visitors are tracked.
This is a little bit technical, but you don’t need to be a developer to understand it.
On the flip side, if you take the time to learn this, everything will be 10x easier down the line.
How a web analytics tool like Google Analytics works can be summarized in three basic steps:
- Data collection
In order to use Google Analytics, website owners or webmasters need to install a tracking code on their site.
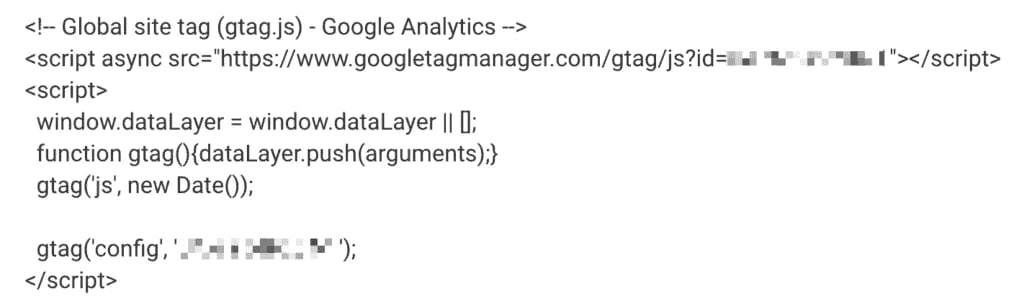
This code collects visitor interactions happening on that site like pages visited, clicks on specific elements of the page, or even purchase transactions.
An important element of the tracking code is being able to tell one visitor from another. For example, whether two pages were visited by a single user or different ones.
To do this, the tracking code stores a small snippet of code, called a “cookie”, in each of your visitor’s browsers (e.g. Google Chrome, Firefox, Safari, etc.)
- Data transmission
Next, the tracking code sends the interaction data along with the information it has about the user to Google Analytics.
- Data processing
Finally, Google Analytics takes all the data it received, calculates metrics, and presents the data in the form of reports.
These reports are what you see when you log into your Google Analytics account.
Understand the AABC of Analytics
The first time you open Google Analytics, it can be hard to make sense of all the reports and metrics presented.
Fortunately, these reports are organized into helpful groups:
- A - Audience
- A - Acquisition
- B - Behavior
- C - Conversion
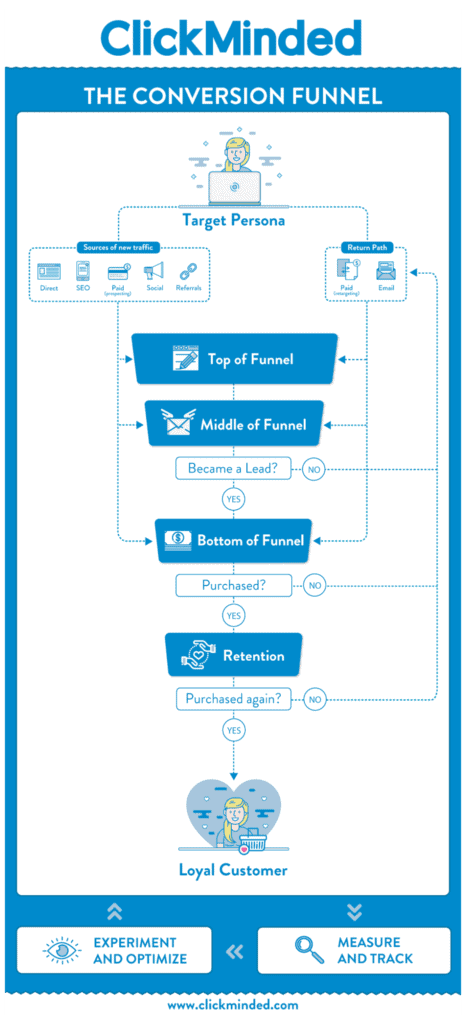
The AABC groups map metrics and reports in a way that makes it easier to analyze the performance of your sales funnel.
(For a refresher on sales funnels, check out the Sales Funnels Strategy Guide.)
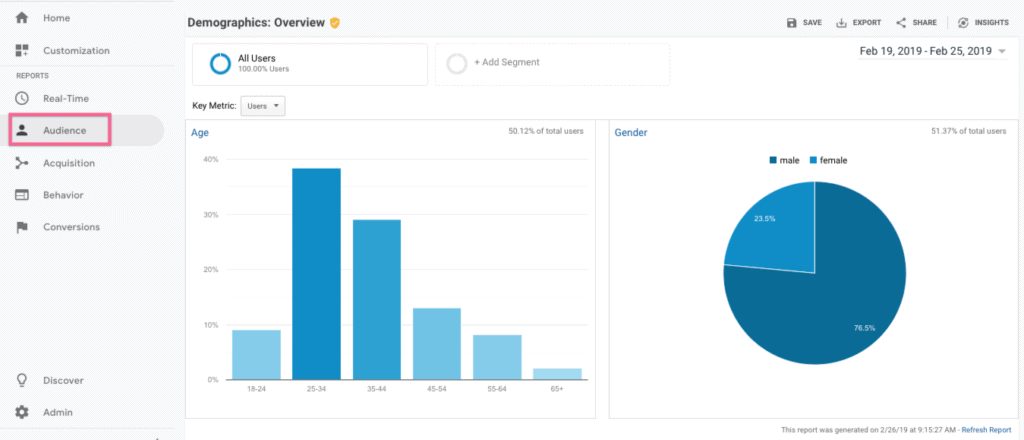
Audience reports include metrics about who your visitors are, which can help you define your target persona.
This includes data like age, gender, location, language, and interests.
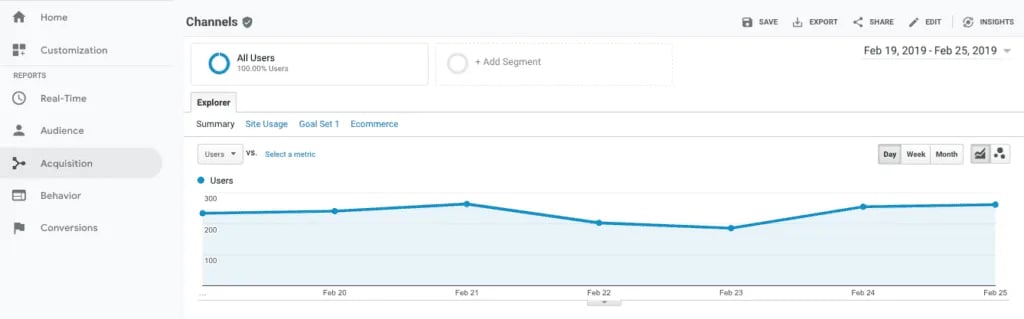
Acquisition reports tell you where your visitors are coming from. This is helpful in analyzing the performance of the top of your funnel.
This includes reports about the sources of traffic or performance of specific campaigns (e.g. Facebook Ads).
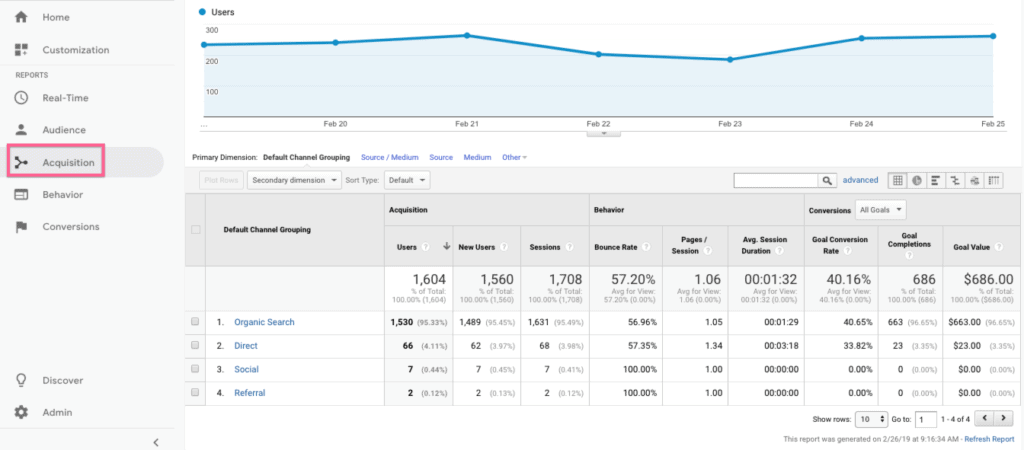
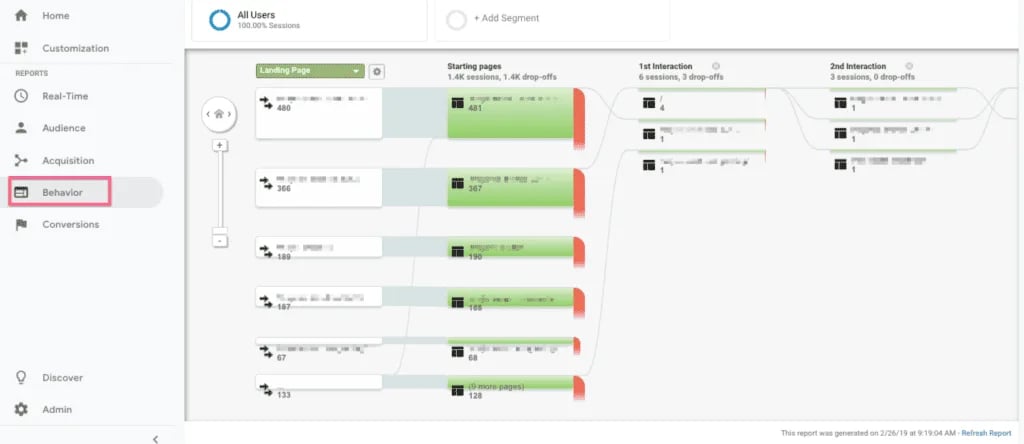
Behavior reports teach you what your visitors do once they are on your site. This data is important to understand the middle and bottom of your funnel.
This includes reports like the most popular landing and exit pages or the most common behavior flows within your website.
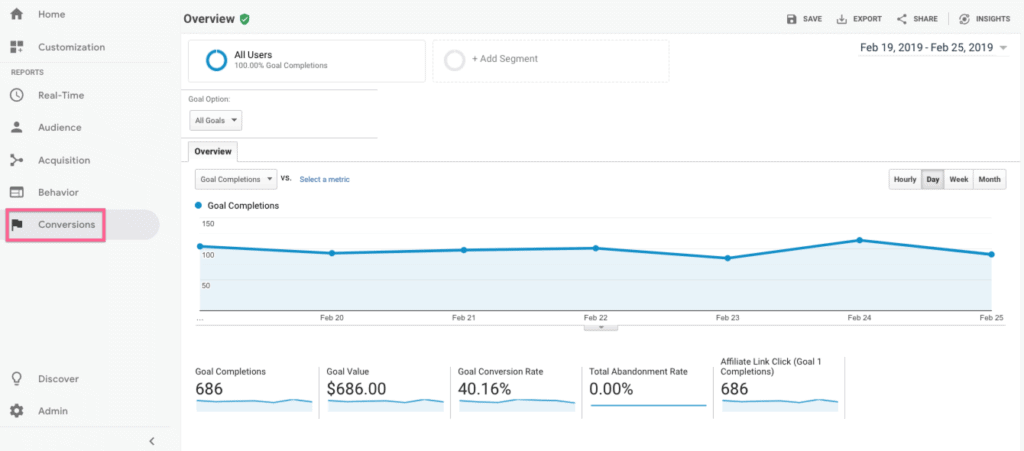
Conversion reports show how important conversions happen on your site. You will use this data to analyze the middle and bottom of your funnel.
This includes reports about goal conversion rates, revenue, or sales per product.
Take some time to get familiar with the different reports within each group.
You don’t need to understand or even dig deep into each of them yet, but having knowledge of what’s available in the tool is fundamental for the next step of creating a web analytics strategy.
Create and Implement a Measurement Plan
This is where things start to get interesting.
Your measurement plan is a simple document that will allow you to have a relentless focus on what truly matters for your business.
By implementing your measurement plan, you will be able to quickly determine the health of your entire business in a few minutes, identify when something is wrong, and even figure out if campaigns are having a positive impact…
To create a measurement plan, you need to go through four steps:
- Define your business goals
- Identify proxies for those business goals
- Choose KPIs to track performance
- Create relevant segments
If this is the first time creating a measurement plan, you’ll create this for your sales funnel.
Let’s go through each of these next and use an example of a business offering delivery of flower arrangements in the US—we’ll call this business “Farrah’s Flower Delivery.”
If you want to follow along, click here to get a copy of our measurement plan template.
Define your Business Goals
The first step is to figure out what the business’s most important goals are.
Since you’re creating a measurement plan for your sales funnel, you’ll determine the most important goal for each stage of the funnel.
You’re only allowed to choose one goal per stage of the funnel.
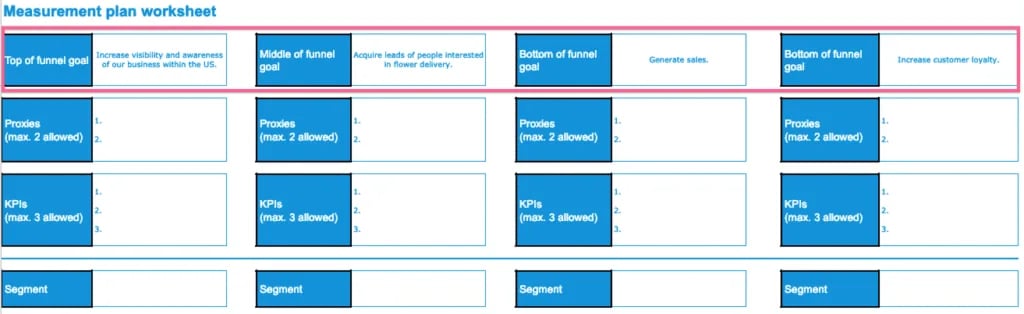
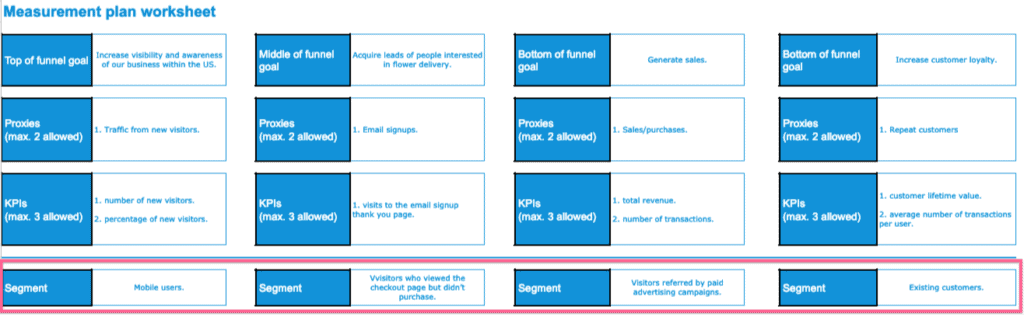
For our example business, Farrah’s Flower Delivery, these will be our goals for each stage of the funnel:
- Top-of-the-funnel goal: Increase visibility and awareness of our business within the US
- Middle-of-the-funnel goal: Acquire leads of people interested in flower delivery
- Bottom-of-the-funnel goal: Generate sales
- Monetization, retention, and love goal: Increase customer loyalty
We’re just getting started but, if you’re following along, your measurement plan should look similar to this so far:
Most business owners focus too much on just the bottom-of-the-funnel goal: Sales or revenue.
If you did this, you’d know when sales go up or down, but it would be hard to figure out why.
By mapping a goal for each stage of the funnel, you get the full picture of the health in your business.
This way, you can fix problems (like a drop in the number of leads collected) before it even starts to noticeably hurt your bottom line.
Identify Proxies for Your Business Goals
Now that you picked your most important business goals, it’s time to find proxies for each of them.
Business goals are big aspirational objectives—because of that, they are also sort of vague.
After all, you can’t really measure “visibility” or “customer loyalty”.
Proxies help you solve this “vagueness” problem.
Proxies are actions or events that happen on your website that help you translate those objectives into something measurable.
For example, a proxy for “visibility” could be how much new traffic your website gets; a proxy for “loyalty” could be the number of repeat customers.
To keep this simple, stick to a maximum of two proxies per business goal.
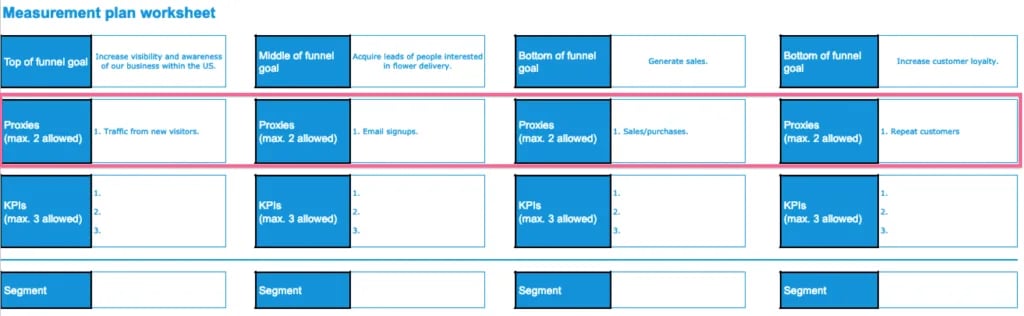
If we try to find proxies for our example business, Farrah’s Flower Delivery, we might get something like this:
- Top-of-the-funnel goal: Increase visibility and awareness of our business within the US
- Proxy: Traffic from new visitors
- Middle-of-the-funnel goal: Acquire leads of people interested in flower delivery
- Proxy: Email signups
- Bottom-of-the-funnel goal: Generate sales
- Proxy: Sales/purchases
- Monetization, retention, and love goal: Increase customer loyalty
- Proxy: Repeat purchases
Our measurement plan now looks like this:
It can take some creativity to figure out proxies for business goals but, with time, you will get better at doing this.
Just like the previous step, picking proxies will force you to focus on getting your website visitors to perform just a few events or actions—if anything is not on the list, you shouldn’t spend time or resources on it.
Choose KPIs to Track Performance
At this point, you’ve written down your most important business goals and identified proxies that make it easier to measure those goals.
Now is the time to assign KPIs to each proxy.
KPIs allow you to translate actions on your site (a.k.a. proxies) into metrics you can easily find and read with Google Analytics.
In other words, you’re translating words into numbers.
For example, let’s say you want to measure “email signups”.
If you have a form on your site where users can input their emails to sign up for your newsletter or download a freebie, there are a couple of ways you could do this:
- You could track the number of visitors who click on a button to submit the form
- You could track the number of visitors who visit the thank you page after submitting the form
Either of these is a good KPI for email signups because you can easily set these up and view them on Google Analytics.
To keep this simple, you should stick to a maximum of three KPIs per business goal.
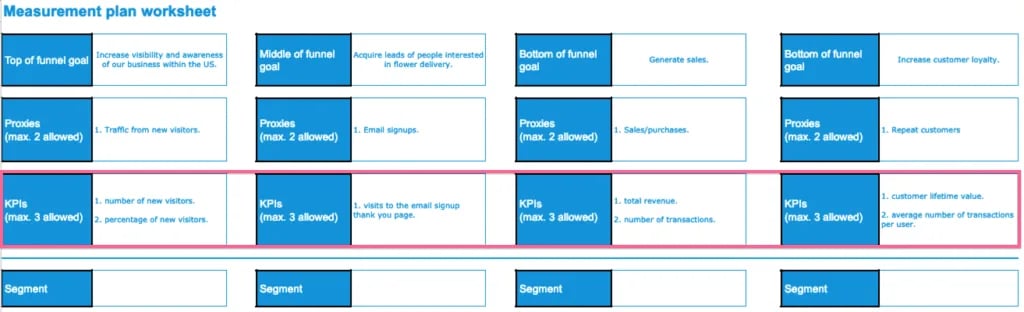
If we were to pick KPIs for our example business, Farrah’s Flower Delivery, we might get something like this:
- Proxy: Traffic from new visitors
- KPI: Number of new visitors
- KPI: Percentage of new visitors
- Proxy: Email signups
- KPI: Visits to the email signup thank you page
- Proxy: Sales/purchases
- KPI: Total revenue
- KPI: Number of transactions
- Proxy: Repeat purchases
- KPI: Customer lifetime value
- KPI: Average number of transactions per user
If you’re following along, your measurement plan will look something like this:
Your KPIs remove a lot of uncertainty around whether or not you’re hitting your business goals—if you want to know how your business is doing on a specific stage of the funnel, all you need to do is open Google Analytics and check a couple of KPIs.
Create Relevant Segments
At this point, you’ve come up with business goals, identified proxies for those goals, and came up with KPIs that make it easy to measure success in Google Analytics.
If you’ve gotten this far, you already have better web analytics strategies than 99% of the businesses out there.
Congrats!
With that said, this last step is what will get you to the very top of that 1% of web analysts.
Segments are a method to single out or exclude specific groups of visitors during your analysis of the data. Not every website visitor is the same.
Within most websites, you’ll find:
- Mobile vs. desktop users
- New visitors vs. returning visitors
- Customers vs. non-customers
- Paid traffic vs. organic traffic vs. social traffic vs. email traffic
- Visitors interested in specific types of products
- Visitors in different stages of the funnel
And these are just a few.
Segmenting your visitors allows you to uncover trends or insights that you might’ve otherwise missed because you were only looking at an aggregate of all your data.
For example, you could find that mobile users purchase more often than desktop users. Or maybe current customers are getting stuck at a certain point in the buying process.
Segments are not specific to a business goal, but rather ways to analyze your entire business through the lens of a specific group of website visitors.
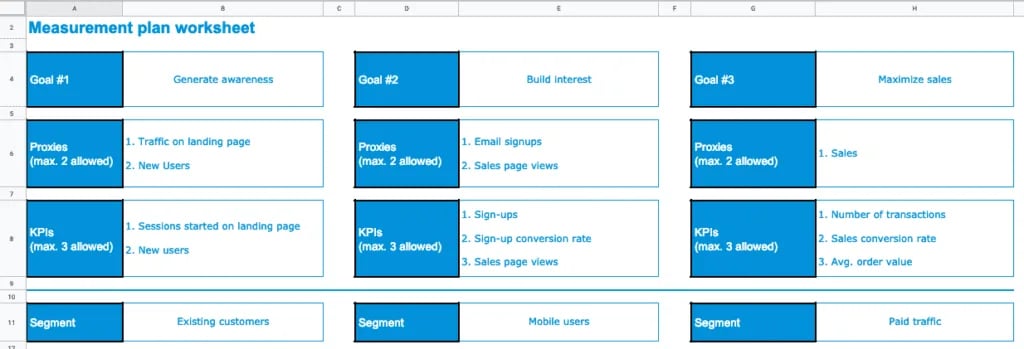
If we were to pick segments for our example business, Farrah’s Flower Delivery, they might look something like this:
- Segment #1: Mobile users
- Segment #2: Most valuable visitors (e.g. visitors who viewed the checkout page but didn’t purchase)
- Segment #3: Visitors referred by digital advertising campaigns
- Segment #4: Existing customers
If you’re following along, this completes our measurement plan and it should look similar to this:
Your measurement plan doesn’t just simplify how you think about analytics, it also forces you to focus all your digital marketing efforts.
- If a campaign you’re running doesn’t directly or indirectly impact the metrics on your measurement plan, then maybe that’s a sign you shouldn’t do it.
- If, on the other hand, you find yourself spending a lot of time and resources trying to improve a metric that’s not in the plan, then you should think about whether this metric should substitute another that is in the measurement plan.
Implement your Measurement Plan
Once you have your plan, it’s time to implement it so you can easily keep track of these things inside Google Analytics.
In some cases, you’ll be able to easily find your metrics in Google Analytics without needing to set up anything else.
For example, this is the case for metrics like users, new users, % new users, bounce rates, or page views.
In other cases, you might need to set up custom events or Google Analytics goals.
Sidenote: When we mention Google Analytics goals, we’re not referring to the business goals in your measurement plan. Google Analytics defines “goals” as actions or events that measure how well your site or app fulfills your target objectives. In the case of your measurement plan, you can choose to set up some of your KPIs as Google Analytics goals.
For example, if your measurement plan includes KPIs like button clicks, session time, purchases, or pages per session you will have to set these up manually.
Once you’ve set these up, Google Analytics will automatically calculate some other helpful metrics like conversion rate per goal or revenue per channel.
This is perhaps the most technically challenging part of your web analytics strategy. However, we’ve created a detailed walkthrough to help you with that:
Once you’ve set up your KPIs, it’s time to create a few segments, to learn how to do that, check out this resource:
If you’re stuck, read this blog post to get inspiration on segments you could create:
Finally, you should track every effort your company makes to drive traffic to your site, which will allow you to identify campaigns and analyze their performance. You can do that by using UTM parameters in your campaign URLs.
That’s it! You’ve created and implemented a comprehensive measurement plan for your entire sales funnel.
This simple and powerful framework will allow you to focus on what really matters and use data to make better decisions and grow your business.
Once you’ve nailed this one down and are confident you are tracking what truly matters, you can start implementing the same framework in specific areas of digital marketing.
For example, you can use the measurement plan framework to evaluate any specific digital marketing channel: Content marketing, email marketing, digital advertising, SEO, and social media.
Stats: How to Read Web Analytics Reports
Making sense of all the reports within Google Analytics can be very challenging at first.
Explaining each one in detail would make for a very long and boring read.
I’m not going to do that to you.
Instead, we’ll do something better.
We’re going to teach you a couple of basic principles that will allow you to easily make sense of everything all by yourself (without the need to memorize dozens of definitions).
“Teach a man to fish,” right?

The Difference Between Metrics and Dimensions
Metrics and dimensions are the two building blocks of Google Analytics reports.
Simply put, dimensions are qualitative variables (things that can’t be counted or added up) and metrics are quantitative variables (those that can be counted and added up).
- Examples of dimensions: Location, gender, URLs, product name
- Examples of metrics: Number of users, number of page views, revenue, conversion rates
In most cases, you’ll see your dimensions in the left column of tables and metrics on the right side of it:
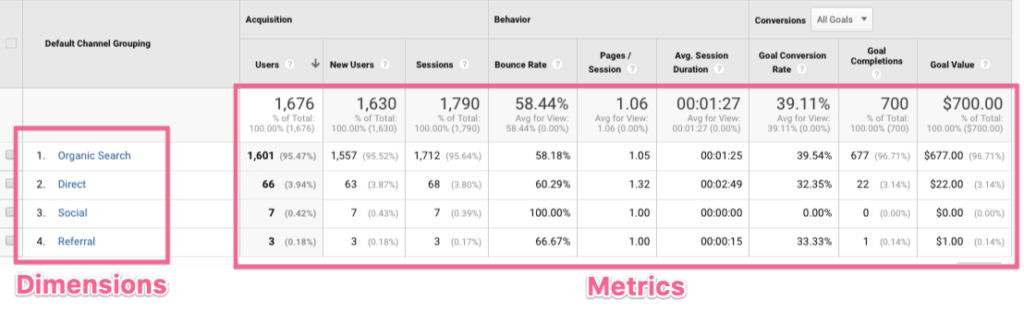
You can see why there is a need for both for web analytics to be actionable.
Without dimensions, metrics would just be numbers without context. Without metrics, dimensions would just be lists of items.
The Three Fundamental Metrics of Google Analytics
There are dozens of Google Analytics metrics. Fortunately, you don’t need to memorize exactly what each of them mean or how they are calculated.
Instead, you can make sense of most metrics by understanding the three fundamental metrics of Google Analytics: Users, sessions, and pageviews.
- Users: A metric that measures how many users have visited your site.
- Sessions: A metric that measures how many times users have visited your site and performed actions within a specific timeframe (click here to learn more about how Google Analytics tracks sessions).
- Pageviews: A metric that measures how many times pages on your site have been viewed.
Sounds simple, but let’s dig in a bit deeper to understand this.
Let’s say we have the following scenario of a user coming to your site over several days:
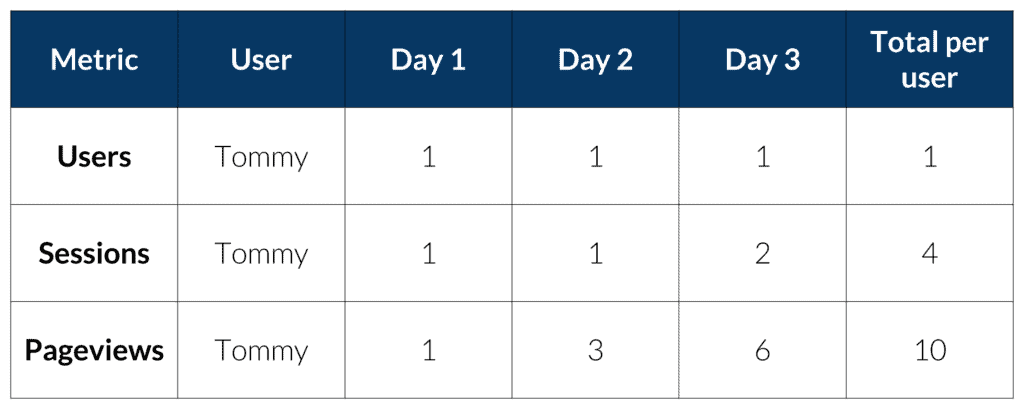
On day 1, a user named Tommy visited your site once and viewed your homepage.
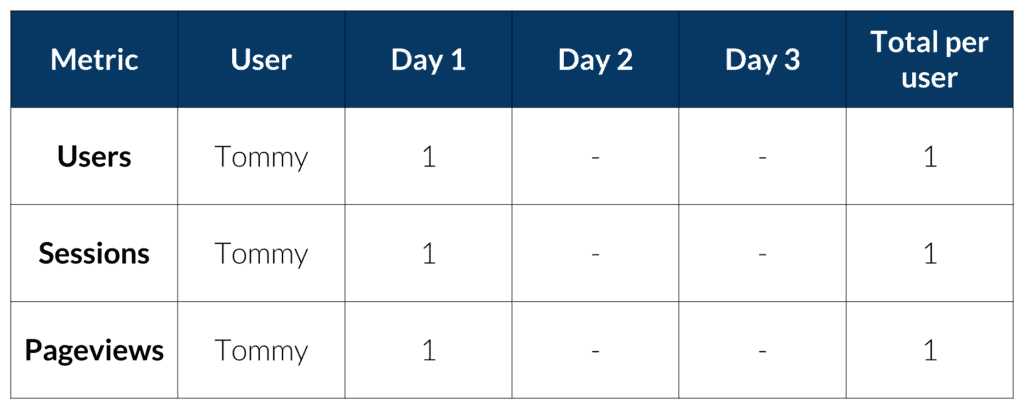
In this case, the math is really simple. There is one user (Tommy), one session (a single visit), and one pageview (just the homepage).
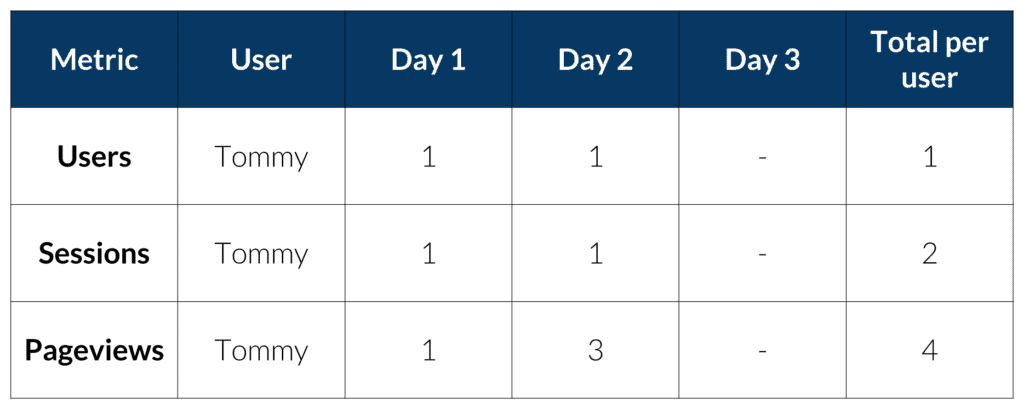
On day 2, Tommy visited your site once again and viewed your homepage, blog post, and sales page.
Still pretty straightforward, right?
Day 2 has one user (Tommy), one session (a single visit), and three pageviews (the homepage, the blog post, and the sales page).
But what’s interesting is what happens when Google Analytics presents totals.
Sessions and pageviews are added up, but users aren’t. That’s because Google Analytics knows (thanks to the cookie placed on the browser) that it’s Tommy who came back to your site and not a different user.
That’s why “users” is a much better metric than sessions or pageviews to assess growth in traffic.
Finally, on day 3, Tommy visited your site once in the morning and again at night, and viewed your homepage, and five different blog posts.
You probably already know what happens.
Google Analytics will count one user (Tommy), two sessions (a visit in the morning and another at night), and six pageviews (homepage and five blog posts).
Now, let’s see what happens if another guy, Chris, also visited your site over the same period of time:
- Day 1: Chris visits your site once and views three sales pages
- Day 2: Chris didn’t visit your site
- Day 3: Chris visits your site and views the homepage
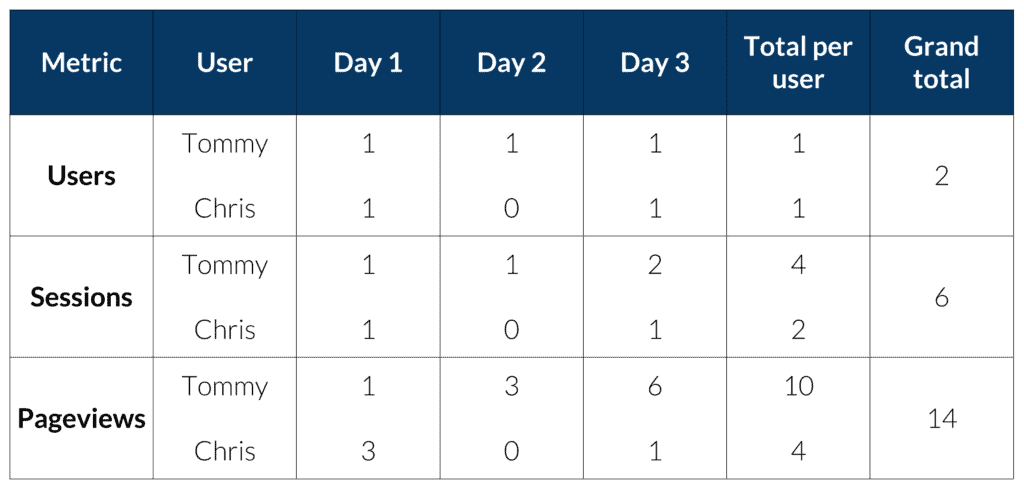
In this case, the total number of users is added up because each of them was identified by Google Analytics as a unique user. Plus, all sessions and pageviews are simply added up.
Once you understand the differences between users, sessions, and pageviews, it will be much easier to make sense of other metrics.
For example, after looking at the example above, it’s easy to understand the metric “pages per session”, which will simply be the average number of pages each user views on any given session. In this case, pages per session will be 2.3 (14 pageviews divided by 6 sessions.)
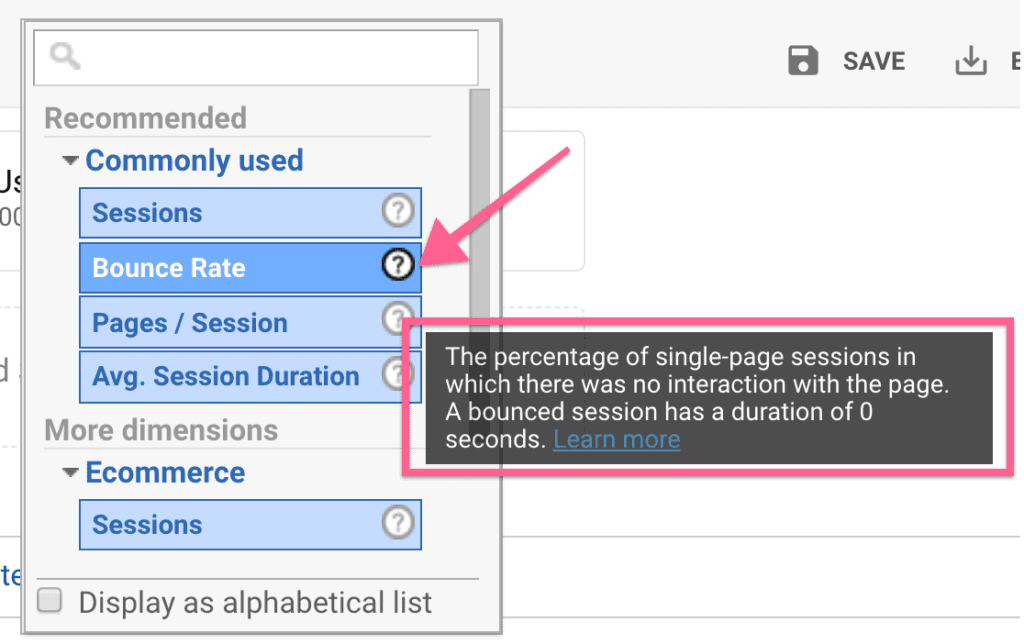
Lastly, if you find a metric you don’t understand, you can simply find the definition and more information about it directly inside Google Analytics:
Next, let’s take a look at the tools you’ll need to use to implement your analytics strategy.
Power-ups: Web Analytics Tools

It seems like there are 20 new tools launched every day that promise to make analytics simpler and allow you to automagically find insights to massively grow your business.
Some of these are dumbed-down versions of Google Analytics, and others are way-too-sophisticated tools that you don’t need unless you’re an analytics pro working at a huge company.
Our recommendation is to avoid these at all costs until you’ve actually learned how to properly use the basic tools.
Some of the biggest, most profitable companies in the world use Google Analytics to inform their decision-making. I have a funny feeling you’ll be just fine without those other tools.
Fortunately, if you’re a beginner, there are only two you absolutely need to use:
- Google Analytics: The most popular web analytics tool in the world. The free version of Google Analytics can work for the analytics needs of small businesses all the way up to massive companies. Check out Google Analytics
- Google Tag Manager: This is an essential tool to use along with Google Analytics. With Google Tag Manager, you can easily install Google Analytics on your site and set up custom tracking without the need to touch a single line of code. Check out Google Tag Manager
Helpers: Great Web Analytics Experts And Blogs to Follow
Discussions and blogs about web analytics tend to get very technical very quickly, which can make it really hard for a beginner to get into this discipline.
Fortunately, some people do the work of creating great content that helps beginners and experts alike to make sense of web analytics.
Here are some of our favorites:
Avinash Kaushik
Perhaps the most well-known web analytics expert in the world. He has written blog posts that ended up becoming fundamental to how people think about web analytics. His content is not highly technical, but rather very strategic and easy to digest.
Check out Avinash Kaushik’s blog
Jeff Sauer
Another one of our favorite web analytics experts out there. Jeff is an analytics consultant and instructor whose content tackles complicated topics and makes them easy to understand for a beginner and intermediate web analysts.
Check out the Jeffalytics blog
Google Analytics Help Center
If you are having problems understanding how a particular aspect of Google Analytics works, this should be the first thing you check. The Google Analytics team has spent years building a massive documentation library that covers most of what a beginner may need to properly use the tool.
Check out the Google Analytics Help Center
Measure School
If you are looking for easy, up-to-date video tutorials on anything related to Google Analytics or Google Tag Manager, you’ll most likely find that Julian from Measure School has already created it.
Check out the Measure School YouTube Channel
Simo Ahava
If you’re looking for more advanced content on Google Tag Manager and Google Analytics, you should check out Simo Ahava’s blog. It’s not an easy read for beginners, but we can’t tell you how many times we’ve run into a problem with our Analytics implementation and found the exact solution within Simo’s blog.
Quickstart Guide: Becoming a Web Analytics Expert in Record Time

Like with any digital marketing skill, practice is the only way to improve your skills as a web analyst.
When you’re a beginner, you have three options to get hands-on experience:
- Create an analytics strategy for your own business. If you already have a business, you can simply use what you’ve learned to grow it.
- Find a business with an existing website that’s getting traffic, that will allow you to help them with web analytics and give you access to their website data (maybe this is a business you already work for, a friend’s company, or a small business in the place where you live.)
- If you can’t find an existing business to help, you can also start your own website or blog and try to get traffic—we don’t recommend this route for beginner web analysts because it will take some time before you get any meaningful data to analyze.
Once you have this figured out, use the following framework:
- Finish reading this guide, of course.
Outcome: You will have a solid foundation of how web analytics fundamentally works—plus, the final section of this guide will help you avoid some common pitfalls for beginner web analysts.
- Install Google Tag Manager. Check out our guides on how to add Google Tag Manager to a WordPress, Shopify, or Squarespace site. If your paid media setup depends on Meta events, pair that with the Squarespace Meta Pixel guide.
Outcome: You will be able to easily install the Google Analytics tracking code on any site and set up advanced events and conversions without the need to touch a line of code or hire a developer.
For campaign tagging and event setup, use the Google Analytics event tracking code generator before you hand-code anything. If analytics is feeding a broader marketing review, pair this guide with the digital marketing audit template and the digital marketing strategy guide.
- Install Google Analytics. Check out our guides on how to install Google Analytics to a WordPress, Shopify, or Squarespace site.
Outcome: Pretty obvious, right? You need Google Analytics to execute what you’ve learned in this guide.
- Create a sales funnel measurement plan for the business. Check out the “Strategy” section of this guide to learn how to do that (and get a simple measurement plan template.)
Outcome: You will have a simple document that clearly outlines the most important goals, proxies, KPIs, and segments for the business. You will use this to simplify your analysis and focus on what truly moves the needle.
- Implement the measurement plan. This walkthrough on setting up Google Analytics events and goals will help with that.
Outcome: You will have set up your Google Analytics account to track exactly the metrics that matter for your business.
Traps: Avoid These Web Analytics Traps
Analytics is a difficult subject for many people and there is a lot of information out there for a beginner to digest.
This can lead to you making mistakes or spending a lot of time trying to understand stuff that aren’t really helpful to you.
We’ve made a list of the most common traps for beginners—so you can avoid them.
Overly-Technical Advice
Many analytics experts love to get super technical—sometimes way too much so.
This is not meant with bad intentions. Many of the companies they deal with have very complicated systems in place that require obscure and highly technical implementations.
When you subscribe to a bunch of analytics newsletters, it’s normal to feel overwhelmed by a lot of the content and afraid that you’re messing something up.
Rule of thumb: If something is way too complicated for you to understand after reading this guide, it’s probably too niche for you to worry about right now.
Vanity Metrics
This is a big one.
A lot of people tend to focus too much on metrics that make them feel good but that don’t really have a meaningful impact on the business.
These are called vanity metrics.
Things like raw traffic, social shares, or the number of page views are common vanity metrics.
That’s one of the benefits of sticking to a measurement plan—to avoid vanity metrics and focus on metrics that matter.
Trying to Always do a Deep Dive into the Data
It’s very easy to open up Google Analytics and go down a rabbit hole while trying to figure out why something happened.
This is fun and something we encourage doing—it’s a great way to learn more about web analytics.
However, you should avoid doing this every time you look at the data.
In general, you should do regular checks (daily or weekly) on the metrics included in your measurement plan and do deep dives more sparingly (monthly or quarterly.)
This will allow you to discover trends and insights that cover more significant periods of time as opposed to getting stuck trying to figure out why a specific change from one day to the next.
Thinking Your Business is Different and You Can’t Use This Framework
People have emailed us saying this so often that we had to include it here.
It happens a lot with people trying to implement analytics for brick-and-mortar businesses (those that have a website), non-profits, or businesses that don’t sell directly through a website (in-person coaching, consulting, medical, etc.)
As long as you plan on using your website to generate business results, you can use the framework explained in this guide.
- If you don’t make sales through your site, then track another meaningful conversion like booking a consulting call, requesting a quote, or scheduling a meeting that does happen on your site.
- If you don’t make sales at all, like non-profits, then you can track donations instead (it’s pretty much the same principle.)
Don’t get stuck because your specific case is “different”. If you just use a little creativity, I’m pretty sure you can figure it out. :)