
Useful benchmarks connect marketing activity to pipeline
B2B marketing benchmarks are useful when the metric definition, channel, cohort, sales motion, time period, and source methodology are clear. A visitor-to-lead benchmark from a self-serve SaaS site does not mean much for an enterprise ABM program selling six-figure contracts through buying committees, even if both teams call the metric “conversion rate” in a dashboard.
A single average can be worse than no benchmark when it gets used to plan pipeline, CAC, or revenue targets. If someone takes a generic website conversion rate, multiplies it by traffic, applies a fantasy close rate, and calls it next quarter’s forecast, the spreadsheet may look tidy while the sales team quietly prepares for pain.
Public benchmark pages are still useful. For example, one B2B benchmark roundup reports a median website conversion rate near 2.9%, an MQL-to-SQL rate near 13%, and a cold-call-to-meeting rate near 2.5%. Another reports that most B2B sites convert visitors to leads at 0.8% to 2.5%, while stronger performers reach 3% to 5%. Those numbers can help you sanity-check your funnel, but they should not become universal targets without context.
The better use of benchmarks is to ask a sharper question: “Does this activity create qualified pipeline at a cost and speed that supports the revenue plan?” Traffic, clicks, form fills, MQLs, email opens, and social engagement all have a place in measurement, but they need to roll up into opportunity creation, opportunity progression, win rate, CAC payback, sales cycle, and revenue.
Use external benchmarks as planning inputs, then compare them against your own definitions and historical performance. If you need a broader baseline set, start with ClickMinded’s marketing benchmarks guide. If the team is still debating what each KPI actually means, clean that up first with marketing metrics. Otherwise, you end up benchmarking one team’s “lead” against another team’s “person who downloaded a PDF while avoiding work.”
B2B marketing benchmark summary table
Use this as a fast planning reference before you build the real model. Some figures are source-specific. Others are planning ranges synthesized from cited sources because public B2B benchmarks rarely define funnel stages the same way. That is normal, and it is why definitions matter.
| Metric | Useful range or baseline | Source context | Caveat |
|---|---|---|---|
| Website visitor-to-lead conversion | 0.8% to 2.5% typical; 3% to 5% stronger | Planning range from cited B2B lead gen sources and lead generation statistics | Depends on offer intent, traffic source, form friction, and how “lead” is defined |
| Lead-to-MQL | Use your internal cohort baseline first | Planning range from cited sources | MQL rules vary too much to compare cleanly |
| MQL-to-SQL | Around 13% appears in public B2B benchmark roundups | Source-specific public B2B digital marketing benchmark cited earlier | Moves with SDR rules, lead source, response speed, and SQL definition |
| SQL-to-opportunity | Use conversion by source and segment | Planning range from cited sources | Demo requests and cold outbound SQLs should not share one benchmark |
| Opportunity-to-close | Use win rate by deal size, segment, and source | Planning range from cited sources | Enterprise ABM, inbound SaaS, and referrals behave differently |
| CAC | Benchmark by model and payback | Planning range from cited SaaS unit economics sources | CAC needs ACV, gross margin, retention, and sales cycle context |
| CAC payback | 15 to 20 months median planning range; 12 to 18 months healthier target | Aleph shows 16 months in 2025, with KeyBanc SaaS survey context | SMB can pay back faster; enterprise often takes longer |
| Marketing spend as % of revenue | 7% to 12% for many B2B firms; SaaS often 10% to 15% | Planning range from cited budget benchmark sources | Growth stage, category maturity, sales capacity, and investor expectations move this fast |
| Pipeline contribution | 25% to 45% marketing-sourced; 60% to 85% marketing-influenced for B2B SaaS | Source-specific B2B SaaS pipeline benchmark cited in research | Enterprise ABM may show lower sourced pipeline because sales and marketing touch the same accounts |
| Email benchmarks | 35.63% open, 2.62% click, 0.22% unsubscribe | Mailchimp all-user benchmark, not B2B-only | Privacy changes distort opens; clicks and conversions matter more |
| Paid search | Use intent-specific CPC, CTR, CVR, and CPL | See google ads benchmarks | Separate brand, competitor, and nonbrand search |
| LinkedIn ads | Use CTR, CPC, CPL, and pipeline by audience, seniority, objective, and offer | See linkedin ads benchmarks | Cheap leads can still become expensive pipeline |
| Content, SEO, and social | Measure qualified leads, assisted pipeline, sales cycle influence, clicks, and conversions | Planning range from cited content, SEO, and social sources | Traffic and engagement can overstate performance when buying intent is low |
| Landing page conversion | 6.6% median overall; 3.8% SaaS median | Unbounce 2024 dataset: 41,000 pages, 464 million visits, 57 million conversions | SaaS is a useful B2B proxy, not a universal target |
| Channel-to-landing-page conversion | Email around 19%, paid social around 12% | Channel-specific planning figures summarized from Unbounce context | Intent and offer type matter more than the channel label |
| Landing page optimization | Compare by page type and industry | See landing page conversion benchmark | Demo, webinar, ungated content, and pricing pages need separate benchmarks |
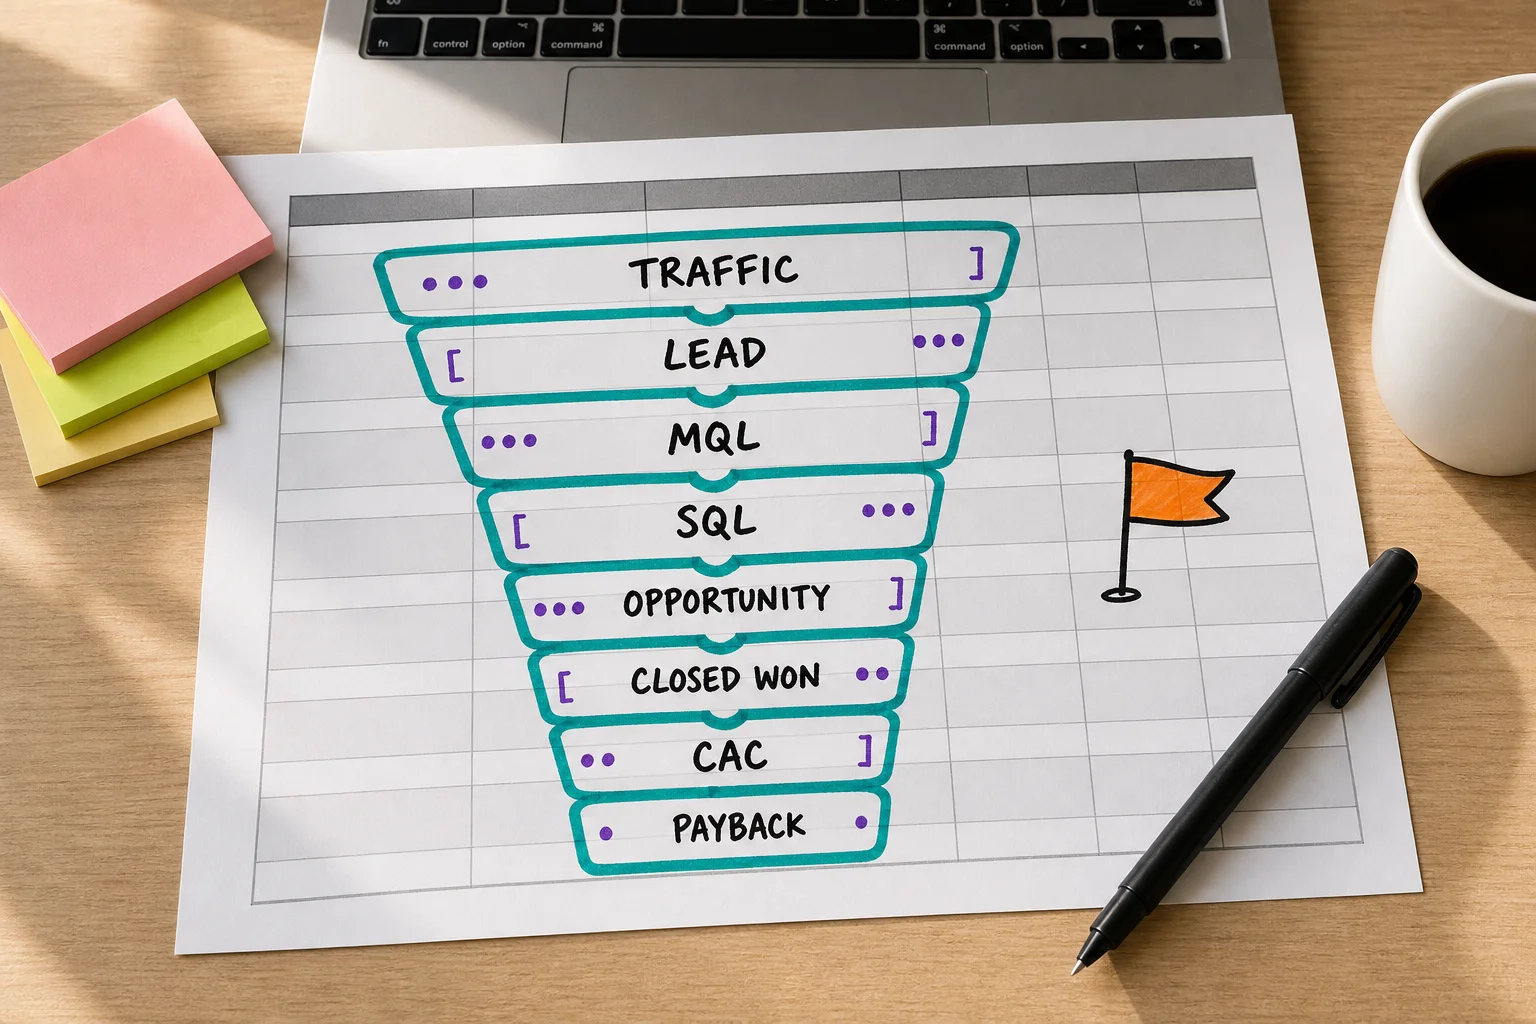
Treat the table as a starting point, not a grading system. The numbers help you spot obvious gaps, build first-pass forecasts, and decide where to inspect the funnel. Your cohort data, CRM definitions, channel mix, and sales cycle math still win.
Define the metric before you compare the benchmark
Benchmark math breaks fast when two teams use the same metric name for different events. If your MQL is a content downloader and another company’s MQL is a demo requester, the comparison is not reliable. Same label, different intent, different denominator.
Anchor each metric to a CRM object, lifecycle stage, and event. HubSpot’s default lifecycle stages move contacts and companies through Lead, MQL, SQL, Opportunity, and Customer, with Opportunity often tied to deal creation and Customer tied to a won deal. Salesforce works differently: a Lead is a pre-qualified CRM record, and converting that Lead can create an Account, Contact, and Opportunity. A converted Salesforce Lead does not equal a marketing MQL by default.

Document definitions like these before you trust B2B marketing benchmarks:
| Metric | Define before comparing |
|---|---|
| Visitor-to-lead | New leads divided by visitors or sessions. State whether repeat form fills, existing contacts, chat leads, trials, and event signups count. |
| Lead-to-MQL | MQLs divided by leads. State whether rejected, duplicate, student, vendor, competitor, and out-of-market leads stay in the denominator. |
| MQL-to-SQL | SQLs divided by MQLs. HubSpot describes an SQL as a contact or company sales has qualified as a potential customer, but your team still needs a written sales acceptance rule. |
| SQL-to-opportunity | Opportunities divided by SQLs. Define whether opportunity creation happens after first meeting, discovery, confirmed budget, or another CRM stage. |
| Opportunity-to-close | Closed-won deals divided by opportunities. State whether you use all created opportunities or only sales-accepted ones. |
| Win rate | Closed-won divided by closed-won plus closed-lost, or by all created opportunities if your CRM reports it that way. Those are different numbers. |
| Pipeline contribution | Marketing-sourced or marketing-influenced open opportunity value. Define whether pipeline means all open opportunities or only qualified-stage opportunities. |
| CAC | Sales and marketing acquisition cost divided by new customers, or by new ARR in SaaS. Handle salaries, tools, agency fees, and sales comp the same way every time. |
| Payback period | CAC divided by gross margin-adjusted monthly recurring profit, or another documented monthly contribution measure. |
| Sales cycle length | Days from lead creation, MQL date, SQL date, opportunity creation, or first meeting to closed-won. Pick one starting line. |
Numerator and denominator choices do most of the damage. A lead-to-MQL rate that excludes rejected leads will look better than one that includes every form fill. A visitor-to-lead rate that counts repeat contacts will look better than one that only counts net-new leads.
Keep the metric dictionary near your dashboard. ClickMinded’s marketing metrics and marketing statistics resources can help with naming, but your CRM rules decide whether the benchmark is usable.
Split benchmarks before they hit the planning sheet
Segmentation is the difference between useful planning and misleading planning. The same number can be healthy, weak, or useless depending on sales motion, ACV, buyer type, channel, and intent.
B2B SaaS benchmarks need ACV and go-to-market context. A self-serve SMB product can live with different visitor-to-trial, trial-to-paid, CAC, and payback math than enterprise SaaS sold through reps. CAC payback is a good example. The generic “12-month rule” gets repeated a lot, but recent SaaS summaries put median B2B SaaS CAC payback around 16 months, while SMB SaaS companies below $15K ACV are often benchmarked at 8 to 12 months. Late-stage or public SaaS companies above $250M ARR may show 9 to 12 month payback. Those cohorts do not belong in one “good SaaS benchmark” cell.
Services firms need a different lens. They often have fewer leads, more human qualification, and different margin constraints than product-led SaaS. A consulting firm may care more about lead-to-opportunity, opportunity-to-close, referral quality, and sales cycle length than raw lead volume. One set of published B2B conversion benchmarks puts professional services at 2.5% to 4.0% lead conversion, compared with 1.1% to 2.0% for B2B SaaS. Treat that as source-specific guidance, not a law of physics.
Enterprise ABM can look terrible in a lead-volume dashboard while doing its actual job: reaching fewer accounts with better fit, larger deal potential, and tighter sales coordination. Tier 1 account programs may track MQA-to-meeting rates of at least 25%, plus account coverage, sales follow-up, and buying group engagement.

Channel and intent split the numbers again. High-intent demo traffic should never be compared with top-of-funnel blog traffic. Current PPC benchmark sources show wide variation by industry, channel, and conversion action. That is why our google ads benchmarks and linkedin ads benchmarks pages separate channel context instead of treating paid media as one bucket.
Industry matters too. Aggregate B2B website conversion rates often cluster around 2% to 3%, but that gets shaky when you mix a manufacturing quote request, a healthcare compliance software demo, and a SaaS newsletter signup. Start with industry, then narrow by offer, intent, ACV, and funnel stage.
Tie channel benchmarks to qualified pipeline
Channel benchmarks are useful when they show the full chain from activity to revenue. CTR, open rate, engagement rate, and landing page conversion rate tell you where to look. They do not prove a channel is creating good pipeline.

| Channel | Activity benchmark | Pipeline benchmark | Revenue benchmark |
|---|---|---|---|
| Paid search | CTR, CPC, CVR, CPL | Lead to MQL, MQL to SQL | Cost per qualified opportunity, CAC, payback |
| LinkedIn and paid social | CTR, CPC, CPM, lead form conversion | Account fit, sales acceptance | Pipeline by account tier, opportunity rate, CAC |
| Content and SEO | Rankings, sessions, engagement | Visitor to lead, lead to opportunity | Content-sourced pipeline, influenced revenue |
| Opens, clicks, unsubscribes | Click to meeting, reply quality | Nurture pipeline, expansion, closed-won influence | |
| Organic social | Engagement, follower growth, profile clicks | Assisted visits, demo clicks, account engagement | Influenced opportunities, sales cycle support |
| Landing pages | Page conversion, form completion | MQL rate, SQL rate, offer quality | Cost per opportunity, win rate, revenue per visitor |
For paid search, use google ads benchmarks for CPC, CTR, CVR, and CPL context, then keep going. WordStream’s 2026 PPC benchmark set, based on over 13,000 US campaigns, reports 6.64% CTR, $5.42 CPC, 8.18% conversion rate, and $66.69 CPL. A $70 CPL with a 5% lead-to-customer rate implies about $1,400 in acquisition cost before sales costs.
For LinkedIn and paid social, our linkedin ads benchmarks page covers CTR, CPC, CPL, and form conversion. The useful chain is impression to qualified account to sales conversation to pipeline.
Content and SEO reporting should connect rankings and sessions to visitor-to-lead, lead-to-opportunity, and revenue. CMI found only 29% track cost to acquire a lead, subscriber, or customer, which is where content reporting often gets squishy.
Email opens are a starting signal. Mailchimp reports an average open rate of 35.63%, click rate of 2.62%, and unsubscribe rate of 0.22%, but replies, meetings, expansion revenue, and closed-won influence matter more.
Organic social should feed account and opportunity reporting. Sprout cites LinkedIn engagement patterns around the 3% to 5% range, but engagement still has to connect to assisted visits, demo clicks, and sales conversations.
Landing pages sit between channel activity and pipeline. Use landing page conversion benchmark by offer, source, and intent, then inspect lead quality before celebrating the conversion rate.
Build the plan backward from revenue
Start with the revenue target and work backward through the funnel. Use your own stage rates first, then compare with external B2B marketing benchmarks and broader marketing statistics when your data is thin.
Plain-language model:
Required opportunities = revenue target / average deal size / win rate.
Required pipeline = revenue target x pipeline coverage assumption.
Required SQLs, MQLs, leads, and traffic = each downstream requirement divided by its conversion rate.
CAC payback = CAC / gross profit per period.
Hypothetical example, not a benchmark: $1,000,000 in new ARR, a $25,000 average deal size, and a 25% qualified-opportunity win rate means 160 qualified opportunities. If 50% of SQLs become opportunities, you need 320 SQLs. If 40% of MQLs become SQLs, you need 800 MQLs. Budget those MQLs by channel CAC, sales capacity, and payback.
Bessemer suggests CAC payback targets of under 12 months for SMB, under 18 months for mid-market, and under 24 months for enterprise. KeyBanc and Sapphire track private SaaS CAC payback across more than 100 companies.
Pipeline quality beats MQL volume. Weak opportunities make the model lie. Track cohort progression in your CRM, especially when sales cycles run longer than campaign reporting windows. Keep marketing metrics close for definitions.
Use a benchmark only after it passes these checks
Treat every external number as provisional until the methodology is clear. Endeavor’s report is useful because it discloses 227 responses collected from August 16 to September 8, 2023. Many benchmark pages do less.
Before using a B2B marketing benchmark, check the cohort, year, B2B scope, business type, metric definition, channel, traffic intent, sales cycle, and data source. Survey responses, platform data, customer data, and synthesized ranges are very different source types sharing the same benchmark label.
Use third-party numbers to sanity-check the plan. Then build internal benchmarks by cohort and channel. Start with the broader marketing benchmarks hub, and document your own baseline over the next year or two.