
Treat 2026 lead generation benchmarks as pipeline math
Lead generation statistics are useful only when they answer one question: which leads are likely to become qualified pipeline?
That is the bar for this page. A form fill is a signal, not a trophy. If the person has no fit, no intent, no buying committee access, and no realistic path to revenue, the CRM just gained another low-value record.
The better 2026 benchmarks point that way. In HubSpot’s 2026 marketing data, marketers rank lead quality and MQLs as the top metric at 39%, followed by lead-to-customer conversion rate at 34%. Lead generation volume sits lower at 29%. That ordering matches what revenue teams feel every week: a big lead count can still create a weak forecast.
Use this guide with the marketing statistics hub for source context, marketing metrics for definitions, and marketing benchmarks for comparison logic. For related planning pages, see B2B marketing statistics, B2B marketing benchmarks, PPC statistics, Google Ads benchmarks, and landing page conversion benchmarks.
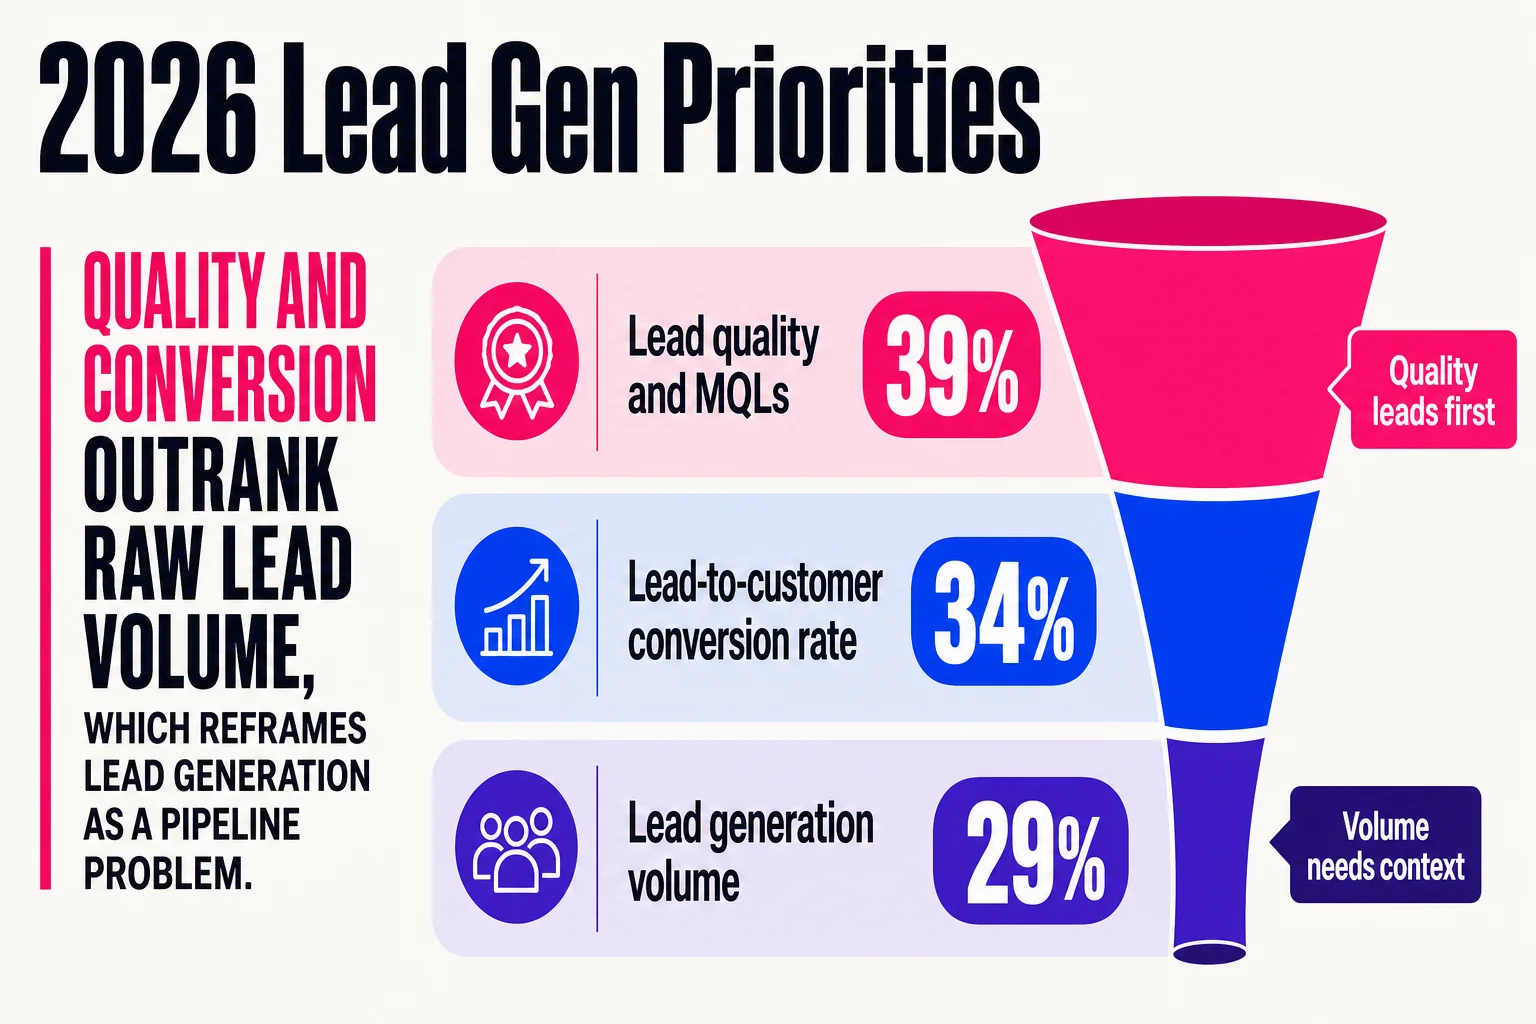
Use these numbers as a starting frame:
| Benchmark area | 2026 signal | How to read it |
|---|---|---|
| Lead quality and MQLs | 39% top priority | Quality is the main marketing KPI to watch |
| Lead-to-customer conversion | 34% top priority | Teams are watching revenue movement, not capture alone |
| Lead volume | 29% priority | Volume still matters, but it needs context |
| MQL to SQL conversion | 10% to 20% typical range | Qualification standards and lead source change the number |
| Healthy B2B SaaS MQL to SQL | 13% | A useful reference point, not a universal target |
HubSpot’s sales guidance puts typical MQL-to-SQL conversion between 10% and 20%, with 13% described as a healthy B2B SaaS benchmark. Treat that as a diagnostic, not a law. Enterprise software, local services, agencies, PLG companies, and high-ticket consulting offers do not share the same funnel shape.
A good /lead-generation-statistics/ page should separate current 2026 findings from recycled older data. Some 2026 roundup pages mix statistics from 2021 through 2025 without making the timeline clear, which can make a stale channel benchmark look current. That is how teams end up defending last year’s dashboard like it came down from Mount Spreadsheet.
Channel mix matters after qualification is defined. EmailVendorSelection’s lead generation statistics coverage groups common acquisition channels across website, blog, email, social, and PPC, which is the right frame: compare sources by lead quality, conversion rate, sales acceptance, and pipeline value, not raw capture count alone.
Quick stats to read before you touch the dashboard
Use this short table as the cheat sheet. The numbers are useful, but only if your team defines each stage the same way. One company’s MQL is a webinar attendee with a Gmail address. Another company’s MQL is a director at a target account who viewed pricing twice and asked for implementation details. Those are not the same lead, even if both sit in the same CRM field.
| Area | Stat or finding | Source | How to use it |
|---|---|---|---|
| Lead quality | 39% of marketers rank lead quality and MQLs as a top metric | HubSpot marketing statistics | Treat lead quality as the first read on campaign health |
| Lead to customer | 34% rank lead-to-customer conversion rate as a top metric | HubSpot marketing statistics | Watch whether leads become revenue, not just records |
| Lead volume | 29% rank lead volume as a top metric | HubSpot marketing statistics | Volume matters after fit and intent are checked |
| MQL to SQL | 13% is a common B2B SaaS benchmark | SmartBug Media | Use it as a comparison point, then adjust by source and offer |
| MQL to SQL | 21% of MQLs became SQLs in one HubSpot-focused analysis | SurveySparrow | Treat it as dataset-specific, not a universal target |
| MQL to SQL timing | 84 days average conversion time in that same analysis | SurveySparrow | Use timing data to set nurture and sales follow-up expectations |
| Lead prioritization | Lead scoring can rank contacts, companies, and deals by actions and properties | HubSpot lead scoring guidance | Route the best-fit and highest-intent leads first |
| Channel mix | Website, blog, email, social, and PPC show up as common lead generation channels | EmailVendorSelection lead generation statistics | Compare channels by sales acceptance and pipeline value |
The 13% and 21% MQL-to-SQL figures can both be useful, even though they conflict. They likely come from different definitions, industries, sales motions, and measurement windows. If your MQL definition is loose, your conversion rate may look sad enough to need its own tiny blanket. If your definition is strict, fewer leads will qualify, but the SQL rate should look cleaner.
Timing needs the same caution. The 84-day MQL-to-SQL figure from SurveySparrow is a pipeline conversion window, not a speed-to-lead benchmark. Speed-to-lead is usually measured in minutes or hours. Lead-to-customer can take weeks or months depending on deal size, procurement, product complexity, and buying committee size. Treat any “64.5 day average lead-to-customer” claim carefully unless the source explains the dataset, stage definitions, and deal type behind it.
HubSpot’s own guidance points teams toward lead quality, MQL-to-opportunity conversion, and response time when diagnosing funnel problems. That is a better dashboard than a giant lead-count tile sitting alone like it just won employee of the month for breathing.
Prioritize the leads sales can actually close
A lead-count goal can make marketing look busy while making sales less efficient. If a campaign brings in 2,000 contacts and 1,850 of them have no budget, no fit, no authority, and no reason to talk this quarter, your CAC math gets weird fast. You paid for media, tools, content, enrichment, routing, SDR time, and follow-up. Then the pipeline report shrugs.
Lead quality fixes the math because it connects acquisition cost to revenue probability. A smaller pool of better-fit leads can produce lower CAC, stronger ROI, and cleaner sales capacity if those leads move through MQL, SQL, opportunity, and customer stages at higher rates. That is why lead generation statistics are more useful when they are tied to lifecycle conversion, not parked beside a giant “new leads” number with confetti.
HubSpot’s lead scoring tool is built for this exact job: prioritizing contacts, companies, and deals based on the signals that suggest a lead is likely to become a customer or close. Those signals can include fit data, engagement, company properties, deal activity, or negative scoring for poor-fit behavior. The point is practical. Sales should spend more time with accounts that match your ICP and show buying intent, and less time politely chasing people who downloaded a checklist because they were avoiding another meeting.
MQL definitions matter here. HubSpot frames lead conversion as the movement from prospect to paying customer or qualified opportunity, which gives marketing and sales a shared business measure. A useful MQL definition should say who qualifies, what behavior counts, when sales accepts the lead, and how rejected leads get recycled.
Benchmarks should come from your CRM first. HubSpot recommends combining historical conversion data with industry benchmarks segmented by channel and deal size, then using attribution reporting to compare quality differences. Start with MQL-to-SQL rate, SQL-to-opportunity rate, opportunity win rate, pipeline value by source, CAC by source, and lead-to-customer conversion. Lead volume belongs on the dashboard, but it should sit behind qualified pipeline and revenue impact.
Use channel stats to choose tests, then judge them by pipeline
Owned channels still carry a lot of the B2B lead-gen workload. EmailVendorSelection reports that 90.7% of marketers use their website and 89.2% use blogs to generate leads and sales, with email marketing at 69.2%, organic social at 65.9%, and PPC at 53.7%. That is a useful snapshot of the channel mix, especially if you need a sanity check before planning budget.
HubSpot’s marketing statistics also point to owned web channels as a major ROI source, with website, blog, and SEO ranking as the top ROI-generating channel. Digital Applied’s 2026 benchmarks put SEO and organic content at a $98 median CPL, 11.4% lead-to-opportunity conversion rate, and $860 cost per opportunity. Paid social comes in higher in that same dataset, with a $178 median CPL and 4.1% lead-to-opportunity conversion rate.
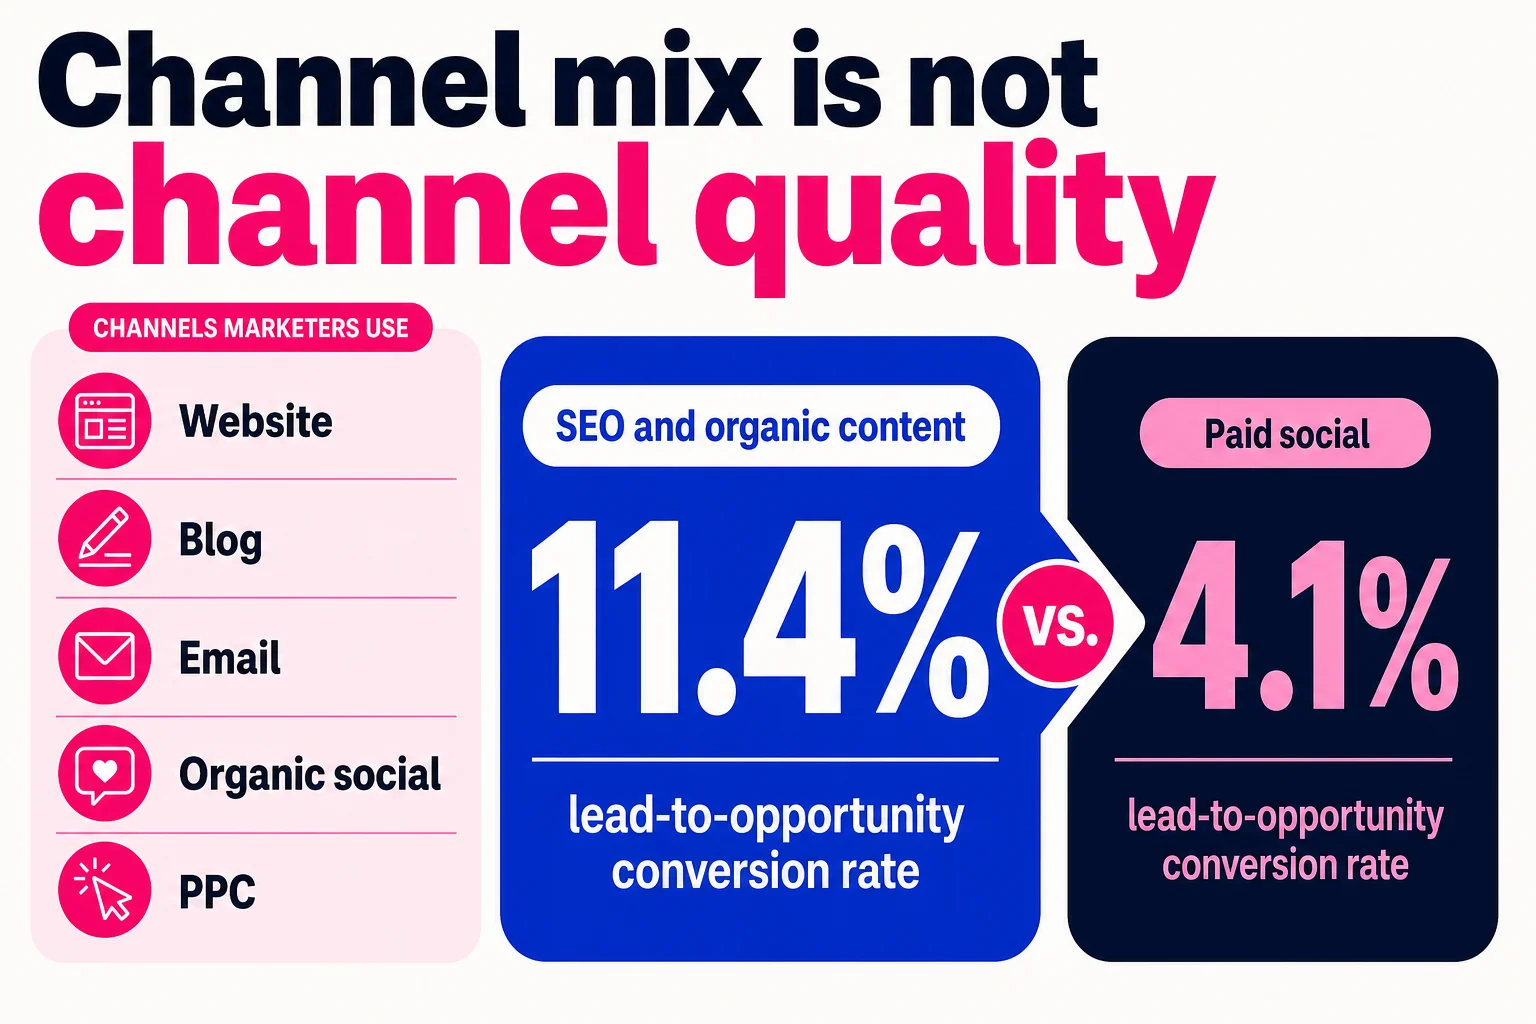
Treat those numbers as starting points, because channel usage is a participation stat. It tells you where marketers are spending time. It does not tell you whether those leads fit your ICP, reach MQL, become opportunities, or close.
Email is the classic example. It shows up everywhere because it is cheap to send, easy to automate, and already tied to CRM behavior. Some roundups cite email as the top B2B lead-generation channel, with 32% of marketers naming it most effective, while other reports cite high adoption across B2B teams. Good. Use email. Just separate newsletter signups, webinar attendees, demo requests, and sales-ready hand raisers in your reporting, or the channel will look smarter than it is.
Track the time between lead capture and revenue
Channel reporting gets more useful when you add time. A lead that becomes a customer in two weeks and a lead that needs six months of education should not sit in the same mental bucket, even if both came from the same blog post or webinar.
The commonly cited lead nurturing stat is ugly: Invesp says 80% of new leads never translate into sales. Other roundups often quote a similar 79% figure and tie the loss to weak nurturing. Treat the exact number with caution, because the original source trail is messy in several versions of this stat. The direction is still useful. Most leads will not buy just because they filled out a form, downloaded a PDF, or sat through 38 minutes of your webinar while also answering Slack.
Visitor intent is just as uneven. Venture Harbour cites that 96% of website visitors are not ready to buy when they arrive. Launch Leads cites that 73% of B2B leads are not sales-ready when they first enter the pipeline. Those numbers explain why a raw conversion rate can look fine while sales still complains, loudly and with screenshots, that the leads are weak.
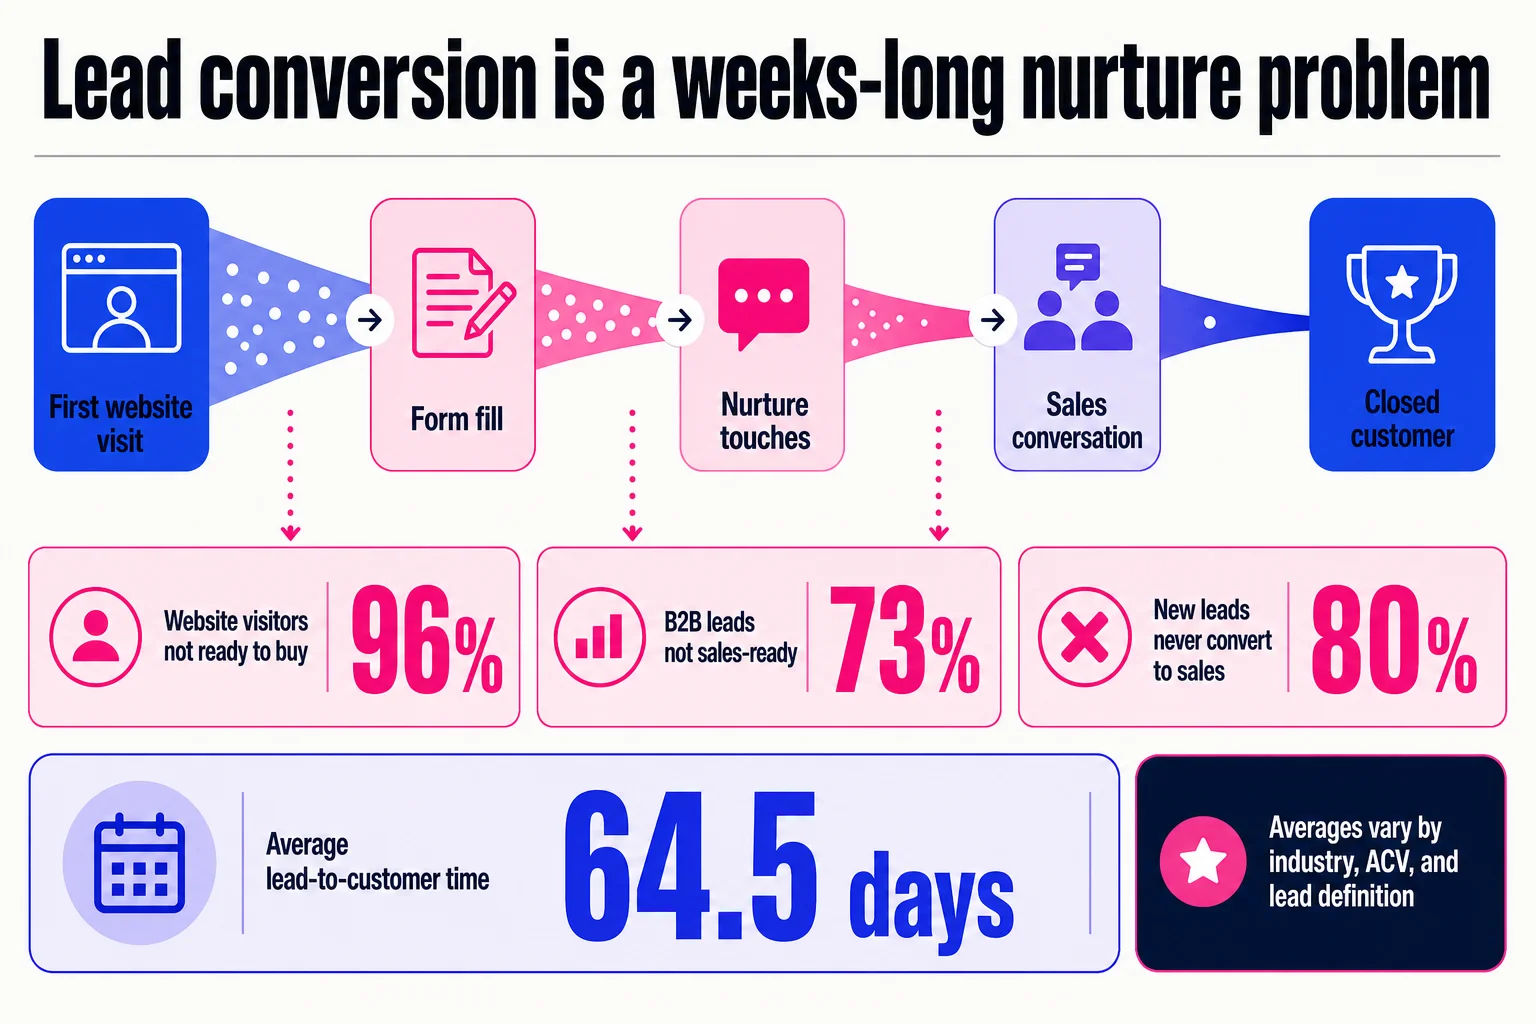
Timing benchmarks need the same skepticism. One commonly repeated EmailVendorSelection and MarketingSherpa benchmark puts average lead-to-customer time at about 64.5 days, but that should be read as an average from a specific analysis, not a universal law of B2B physics. A 1871 benchmark page also notes that conversion rates depend on how “lead” and “customer” are defined, and that sales cycles vary by deal size and buying process.
Use these lead generation statistics to set reporting windows. Track visitor-to-lead, lead-to-MQL, MQL-to-SQL, SQL-to-opportunity, and opportunity-to-customer by cohort month. If your sales cycle is usually 60 to 90 days, judging a campaign after two weeks is basically yelling at bread for not being toast yet.
Common lead generation stats questions
What is the most important lead generation metric? Track MQL-to-SQL rate first, then pipeline and revenue contribution. A typical MQL-to-SQL conversion rate ranges from 13% to 20%, with stronger teams above 25%.
What is a good B2B website conversion rate? Many B2B sites sit around 2% to 4% visitor-to-lead conversion, but the offer matters. An assessment, calculator, or high-intent demo page can beat a generic newsletter form by a lot.
Which channel produces the best leads? EmailVendorSelection’s channel mix points to website, blog, email, social, and PPC as common sources, but channel quality depends on fit and intent. Webinars are often strong too, with 73% of B2B marketers saying webinars produce their highest-quality leads.
Should we benchmark cost per lead? Yes, but do not worship it. A cheap lead that never reaches sales costs more than it looks.