
What are good LinkedIn Ads benchmarks? Start with ranges, not one universal average
LinkedIn Ads benchmarks are useful when they set expectations by campaign type, audience, and funnel stage. They get messy when one average CTR, CPC, or CPL becomes the whole performance review.
For B2B teams, benchmarks should cover click quality, lead quality, account engagement, pipeline influence, revenue attribution, and attribution window. A cheap click from the wrong job function is still a bad click. A $300 CPL from a target account with real opportunity movement can make sense when one enterprise deal can carry the quarter.

ClickMinded is compiling and interpreting third-party benchmark data here. We are not claiming to own the underlying LinkedIn Ads benchmarks. Public sources vary by customer base, year, region, attribution model, campaign objective, and metric definition, so treat these as planning ranges, not universal grades.
| Metric | Planning range or baseline | Source context | Caveat |
|---|---|---|---|
| Sponsored Content CTR | 0.4% to 1.0% | Synthesized from public B2B benchmark pages such as The B2B House, 42 Agency, and HockeyStack | Offer, format, audience warmth, and click definition all matter |
| CPC | $6 to $15 | Same public sources, with LinkedIn’s CPC pricing context for definition support | Seniority, country, audience size, bidding, and objective can move this fast |
| CPM | $30 to $90 | B2B benchmark roundups and LinkedIn pricing guidance | Narrow executive, enterprise, and ABM audiences often cost more |
| CPL | $75 to $300 | B2B benchmark sources and LinkedIn Lead Gen Forms and lead reporting | CPL without title, company fit, account status, and sales acceptance is mostly theater |
| Lead Gen Form conversion rate | 8% to 15% | Public LinkedIn benchmark roundups and LinkedIn reporting context | A form fill can mean buying intent, light intent, or “I wanted the PDF” intent |
| Landing page conversion rate | 2% to 5% | Use with broader landing page benchmarks from /landing-page-conversion-benchmark/ | Page speed, offer, friction, and brand familiarity drive the range |
| Account engagement | Build a baseline by target account list, then compare engaged account rate over time | LinkedIn materials cover Conversion Tracking, Website Demographics, and Campaign Demographics | Usually more useful for ABM than broad lead gen |
| Pipeline influenced and ROAS | Compare CRM opportunity and revenue data over 90 to 180 days | Dreamdata reported LinkedIn Ads delivered a 113% return on ad spend | Attribution model, sales cycle, deal size, and touch timing can change the read |
Use these ranges the same way you would use broader /marketing-benchmarks/ or /b2b-marketing-benchmarks/: for planning, diagnosis, and expectation setting. Then tie them back to your own /marketing-metrics/, CRM stages, sales cycle, and account list.
One LinkedIn Ads average can hide very different campaigns
A public LinkedIn CPC benchmark, LinkedIn CTR benchmark, or LinkedIn Ads CPL benchmark can be useful as a rough planning input. The trouble starts when a benchmark page compresses unlike campaigns into one clean number and everyone pretends the number means more than it does.
Country alone can bend the benchmark. A U.S. enterprise software audience is a different auction than a smaller regional audience in a lower-cost market. Seniority changes it too. Reaching founders, VPs, CFOs, and security leaders usually costs more than reaching broader individual contributor segments, and the higher price may be justified if those people can actually buy.
Audience size matters because narrow targeting limits delivery and can raise CPM or CPC. ABM lists, named accounts, and tight job-title filters often behave differently from broad targeting by function or industry. Warm audiences also need their own comparison set. Retargeting site visitors, video viewers, or engaged accounts should usually beat cold prospecting on CTR and conversion rate, because the audience already has some context.

Objective and format can make comparisons even messier. LinkedIn uses objective-based advertising, where the campaign objective affects available ad formats, bidding strategies, and optimization goals. Sponsored Content driving website visits, a Document Ad promoting ungated content, a Lead Gen Form campaign, and a Video Views campaign can all sit inside the same “LinkedIn Ads” bucket while measuring success differently.
Metric definitions are the quiet trap. LinkedIn’s Campaign Manager “clicks” metric can include interactions such as ad content clicks, CTA clicks, logo or company name clicks, and social actions, while chargeable clicks depend on objective, bidding setup, ad format, and click type. Social actions and Page clicks may count as clicks in reporting but are often not the clicks you paid for or the clicks your landing page saw.
Industry and intent finish the job. A cybersecurity demo request, a consulting benchmark report download, and a broad brand awareness campaign should not share one CPL target. Before comparing against any average, match the cohort: country, seniority, audience size, objective, format, industry, intent level, ABM versus broad targeting, and cold versus warm audience.
Define the metric before you judge the campaign
LinkedIn Ads benchmarks get useful only after the metric definition is nailed down. The formula matters, but so do the click type, conversion event, attribution window, and funnel stage. If you need a deeper KPI refresher, keep the ClickMinded guides to marketing metrics and marketing statistics open while you build your benchmark sheet.
CTR is clicks divided by impressions. Use it to judge whether the ad, offer, and audience match well enough to earn attention. The catch is that LinkedIn clicks can include more than website visits. LinkedIn’s help center says clicks in Campaign Manager can include ad content clicks, CTA clicks, company name clicks, logo clicks, and social actions. A high CTR may mean the offer is working. It may also mean people are clicking the company name, reacting to the post, or opening a form. Treat CTR as an ad relevance signal until you compare it with sessions, form opens, form submits, and downstream conversions.
CPC is spend divided by clicks. CPM is spend divided by impressions, usually per 1,000 impressions. CPC compares traffic cost. CPM compares audience access cost. On LinkedIn, CPC needs a second look because a click may not mean a landing page visit. The chargeable action depends on objective, bid setup, format, and click type.
CPL is spend divided by leads, and it only works when the lead definition stays consistent. A demo request, gated PDF download, webinar registration, and lead gen form submit should not share one CPL target. If sales rejects half the leads, the reported CPL understates the true cost of qualified pipeline.
For LinkedIn Lead Gen Forms, separate form opens from form submits. LinkedIn’s lead reporting distinguishes lead form opens from completed submissions. A strong open rate with weak submits points to friction in the form, offer, or qualification questions.
Landing page conversion rate is conversions divided by landing page visitors or sessions, depending on your analytics setup. If LinkedIn reports many clicks and your analytics platform reports far fewer visits, check click definitions, redirects, consent settings, page speed, UTM tagging, and bot filtering before blaming the page.

Account engagement tracks whether target companies are seeing, clicking, visiting, returning, or taking high-intent actions. The denominator is usually target accounts reached or engaged, rather than individual leads. For ABM, five anonymous clicks from a target account can matter more than one cheap form fill from a company that will never buy.
Pipeline influenced ties ad exposure or engagement to opportunities. Define the numerator, denominator, and attribution rule before reporting it. View-through influence, click-through influence, first touch, last touch, and multi-touch models can all produce different answers from the same campaign data.
ROAS is revenue divided by ad spend. Use it carefully on LinkedIn because many B2B sales cycles run longer than the reporting window marketers use for optimization. Pick the window, document it, and keep the same rule when comparing campaigns.
LinkedIn Ads benchmark ranges by campaign type and intent
A useful LinkedIn Ads benchmark compares your campaign to the closest peer set. Cold Sponsored Content, retargeting, demo capture, and ABM account engagement do not behave the same, even when they use the same format and budget.
The ranges below are planning ranges synthesized from the cited benchmark sources, unless a source is linked to a specific number. Treat them as starting points, not pass/fail grades. For wider B2B context, pair this with our B2B marketing benchmarks and main marketing benchmarks hub.
| Campaign cohort | Primary benchmark lens | Practical planning range or baseline | Caveat |
|---|---|---|---|
| Cold Sponsored Content awareness | CTR, CPM, account reach | Sponsored Content CTR often sits around 0.44% to 0.65% globally, with 0.40% to 0.60% a practical range when targeting is layered. Sponsored Content CPM is reported around $33.80. | Seniority, country, job-function depth, audience size, and format move this fast. A narrow US C-suite audience should not be benchmarked against a broad global campaign. |
| Cold traffic lead gen | CPC, landing page conversion, CPL | A reported LinkedIn CPC baseline of $5.58 is useful directional context. CPL can range from $15 to $350, depending on audience, offer, and creative. | Check click definitions before treating CPC as visit cost. For page performance, compare against landing page conversion benchmarks by offer type. |
| Retargeting | CTR, CPC, conversion, pipeline influenced | Judge against prior site visitors, video viewers, form openers, and engaged accounts rather than cold CTR averages. | Small pools can raise CPM and make weekly results noisy. Watch frequency. |
| Content offers | CPL, Lead Gen Form conversion, lead quality | Content offers and Lead Gen Forms are often reported around 10% to 15%. Lead Gen Forms may reduce CPL by 20% to 30% versus external landing pages. | A cheap guide download can look strong in-platform while producing little sales value. Segment by accepted leads and opportunities. |
| Demo or sales request campaigns | Landing page conversion, CPL, opportunity rate | Demo campaigns often convert around 2% to 5%. CPL usually sits far above content offers because the ask is heavier. | Track by industry, company size, buying role, and warm versus cold audience. |
| ABM target accounts | Reached accounts, engaged accounts, buying committee, pipeline influenced | Use reached target accounts, engaged target accounts, repeat visits, seniority mix, and opportunity influence. | Broad CTR and CPC averages are weak ABM scorecards. A named-account program may look expensive while still reaching the right people. |
| Customer expansion | Account engagement, expansion pipeline, revenue attribution | Compare against customer account penetration, product-interest engagement, influenced renewal or upsell pipeline, and revenue attribution. | Customer lists are warmer but smaller. Attribution windows need to match renewal and expansion cycles. |
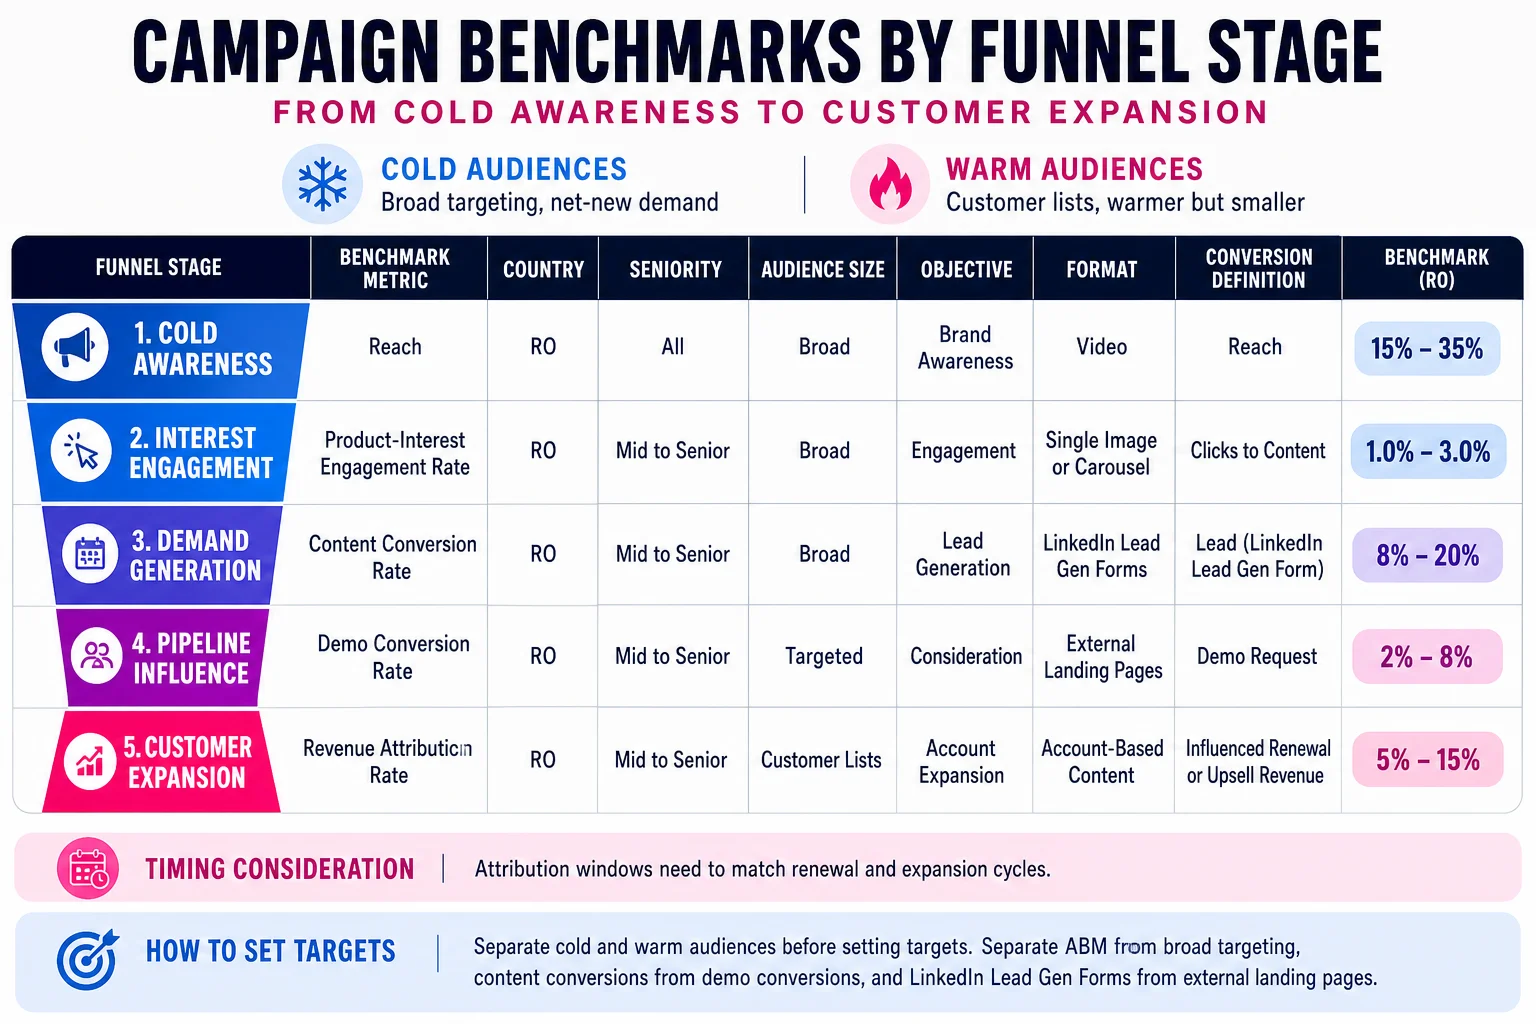
Separate cold and warm audiences before setting targets. Separate ABM from broad targeting, content conversions from demo conversions, and LinkedIn Lead Gen Forms from external landing pages. Put country, seniority, audience size, objective, format, and conversion definition beside every benchmark in your sheet.
Use ROAS carefully. LinkedIn may influence accounts long before an opportunity appears in CRM. A 30-day click window can miss later value, while loose view-through attribution can over-credit ads. Keep the attribution rule visible next to the number, preferably in the same report cell where someone is about to make a budget decision.
Compare benchmark sources by the question they answer
Benchmark sources are useful when you know what they measured. Platform docs are best for metric definitions and billing rules. Agency datasets are better for campaign execution patterns. Attribution platforms can show pipeline and revenue, but their customer base may skew toward teams with longer sales cycles and cleaner CRM tracking. Anonymous roundup pages with no date, cohort, or methodology are weak planning inputs. Fine for a sanity check, dangerous for budget math.
A decent source quality check asks:
- Date or analysis period
- Sample size
- Cohort, including industry, company size, and customer type
- Country mix
- Campaign objective
- Format mix
- Attribution model
- Conversion definition
- Outlier handling
- Whether the source benefits from a specific narrative
For example, one LinkedIn ad benchmarks page says its data comes from $1M USD in spend over 6 months across multiple ad accounts and includes regional breakouts. Useful. It also does not publish client count, industry mix, exact analysis dates, attribution rules, or data-cleaning rules. That makes CTR and CPC directionally helpful, while CPL, CPA, and conversion-rate comparisons need more caution.
Measure account movement before you judge LinkedIn on cost
LinkedIn can look expensive when the report stops at CPC or CPL. That does not make the spend bad if the campaign is reaching senior buyers, named accounts, and multiple people inside the same buying committee.
For B2B, add account engagement benchmarks beside click benchmarks. Track target account reach, account-level impressions, engaged companies, repeat visits, form fills from target accounts, opportunity creation, pipeline influenced, closed-won revenue, and payback window. Some of these will be internal planning benchmarks rather than public averages because the definition depends on your CRM, account list, attribution model, sales cycle, and opportunity stages.
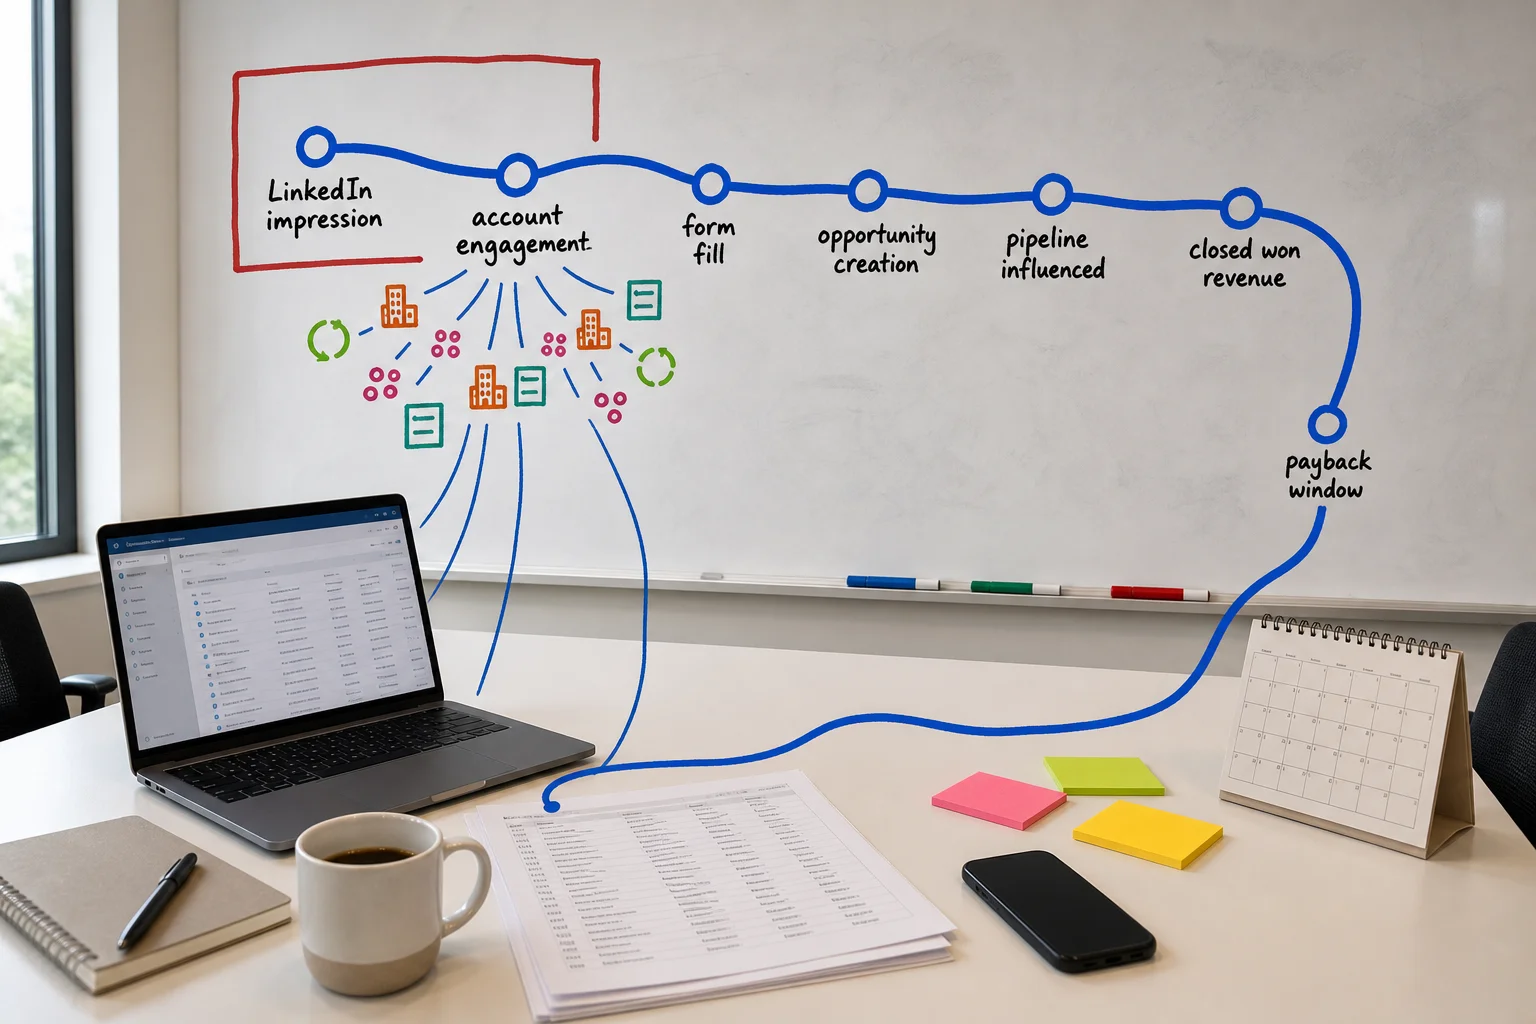
This is where attribution-window selection matters. Dreamdata’s B2B benchmark work reports buying journeys around 88 touchpoints, 4 channels, 10 stakeholders, and 272 to 320 days. A 30-day click window may miss the value of a campaign that warmed a target account months before the opportunity opened.
Dreamdata also reports that LinkedIn ROAS improved from 113% to 121%, while cost per company influenced fell from EUR 154 to EUR 70.11. Treat those as account-based attribution benchmarks from Dreamdata’s customer base, not universal LinkedIn Ads benchmarks. They are useful because they point to the right question for B2B teams: which accounts moved, how far, and within what payback window?
Use this checklist before you change the campaign
Use one benchmark row per cohort, then diagnose. LinkedIn’s objective-based setup matters because the campaign objective controls formats, bidding, and optimization, while the Ads Guide shows format differences that can move CTR, CPC, and CPL.
Checklist:
- Pick the right cohort.
- Define the conversion: form submit, MQL, SQL, opportunity, or revenue.
- Split cold and warm audiences.
- Segment by country and seniority.
- Compare format and objective.
- Check chargeable click definitions.
- Review lead quality and account fit.
- Check target account engagement.
- Set attribution windows with the Insight Tag and CRM stages.
- Compare pipeline, not just CPL.
High CTR with weak conversion points to offer or page friction. High CPC with strong opportunity rate may be fine. Low CPL with poor account fit is just cheap waste. Keep the full benchmark library close at marketing benchmarks.