
Start with metrics that help you make decisions
A metric is a number you can track. A KPI is a metric tied to a specific business goal and a decision you are willing to make.
That distinction saves your reporting system from becoming a museum of charts. Page views, impressions, email opens, clicks, CTR, CPC, and social engagement can all help diagnose what is happening. They do not, by themselves, prove that marketing is working. A campaign with 90,000 impressions and zero qualified pipeline is still a very visible way to spend money.
The better question is: “If this number changes, what will we do?”
HubSpot’s 2026 marketing statistics point in the same direction. The top metrics marketers say matter are lead quality and MQLs at 39%, lead-to-customer conversion rate at 34%, ROI at 31%, customer acquisition cost at 30%, and lead generation volume at 29%. Notice how much of that list sits close to revenue, efficiency, and sales readiness. That is the decision table.
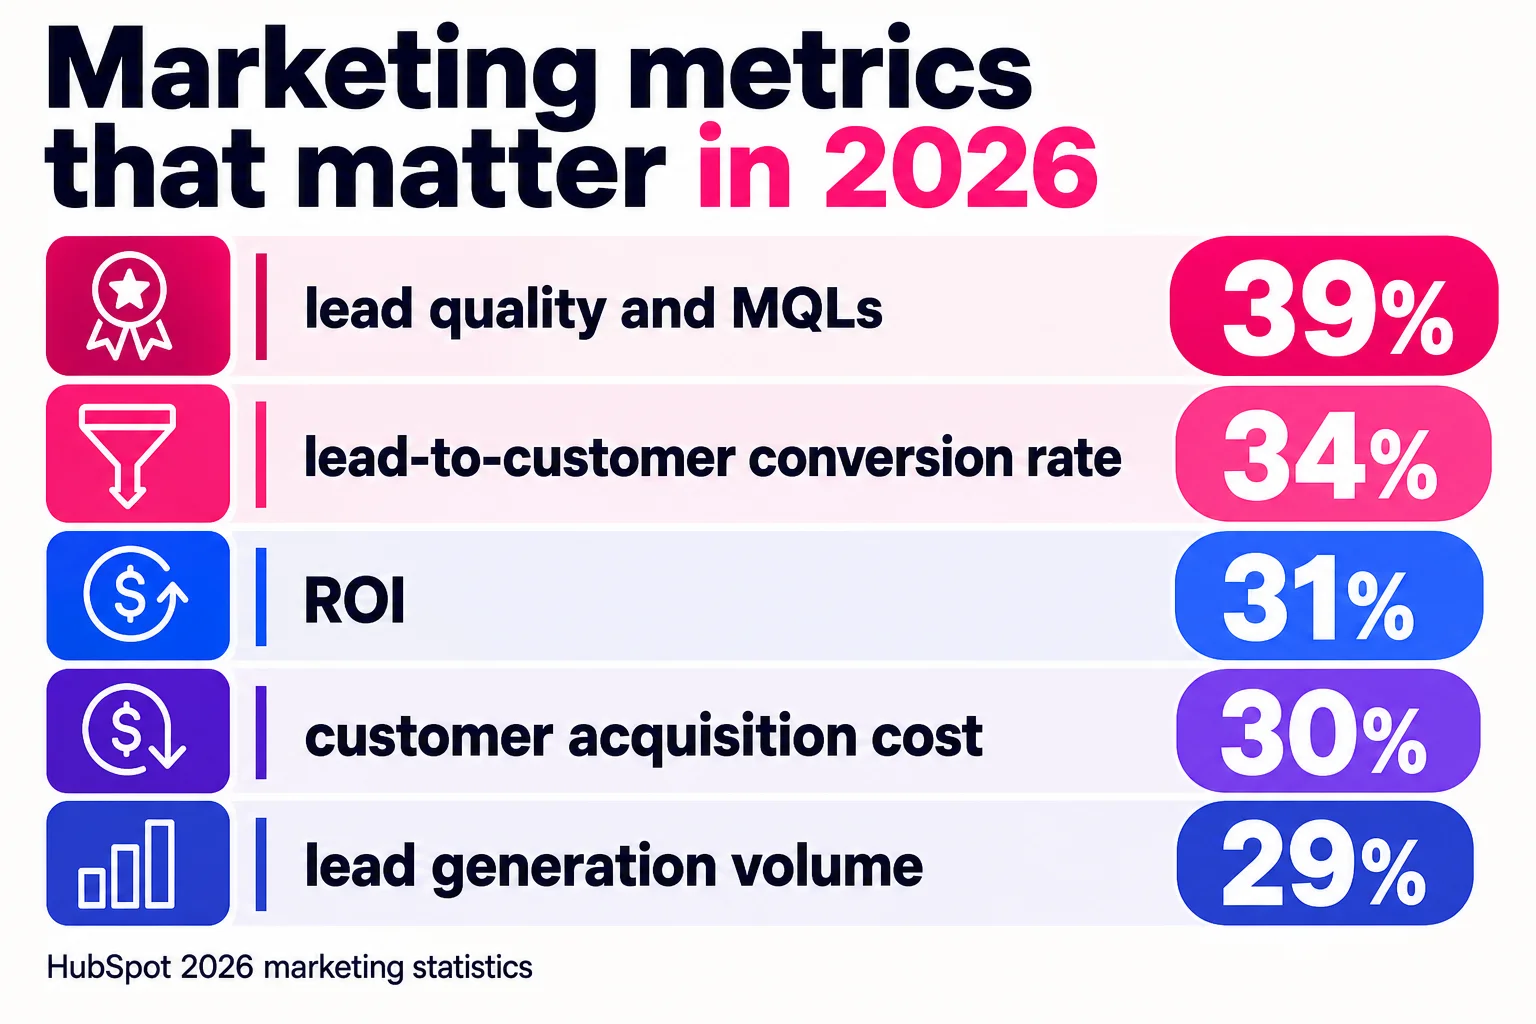
This guide treats marketing metrics as inputs for decisions, not dashboard decoration. We will cover acquisition metrics, engagement metrics, conversion metrics, revenue metrics, and retention metrics, including what each category can tell you and where it can mislead you. Then we will show how to choose the digital marketing metrics that belong in your reporting system based on your business model, funnel, budget, and weekly decisions.
For broader source context, use our marketing statistics hub. For comparison data, use our marketing benchmarks hub.
Use the right related page for the metric
Metrics define what you measure. Statistics explain what external sources are saying. Benchmarks help you decide whether your number is unusually high, low, or normal for a comparable cohort.
Choose goals first, KPIs second, supporting metrics third
A KPI is the scoreboard number for a specific goal. A metric is any number that helps you understand performance. That means every KPI is a metric, but plenty of marketing metrics should stay in the diagnostic drawer with the batteries, old cables, and mystery keys.
The operating model is simple:
- Pick the business goal.
- Choose the KPI that proves progress toward that goal.
- Add supporting metrics that explain why the KPI moved.
- Ask, “What would we do differently if this moved?”
That last question is the filter. If nobody would change budget, targeting, creative, offers, sales follow-up, landing pages, lifecycle emails, or retention work based on the number, it probably does not need prime dashboard space.
| Business goal | KPI | Supporting metrics | Decision it helps make |
|---|---|---|---|
| Profitable acquisition | CAC, ROAS | Impressions, CTR, CPC, conversion rate, cost per lead | Increase, cut, or reallocate spend by channel or campaign |
| Better lead quality | MQL-to-SQL rate, lead-to-customer conversion rate | MQL volume, SQL volume, lead source, form completion rate, sales acceptance rate | Tighten targeting, change offers, adjust lead scoring, or route leads differently |
| More qualified pipeline | Marketing-sourced pipeline value | MQLs by channel, opportunity creation rate, average deal value, sales cycle length | Decide which campaigns deserve more budget and which need a different audience |
| Higher ecommerce revenue | Conversion rate, revenue, ROAS | Add-to-cart rate, checkout completion rate, AOV, product page engagement | Fix checkout friction, change offers, promote different products, or pause weak campaigns |
| Better retention | Churn rate, repeat purchase rate, expansion revenue | Email engagement, product usage, renewal pipeline, support ticket themes | Improve onboarding, build lifecycle campaigns, or focus customer marketing on risky segments |
HubSpot’s 2026 marketing data backs this direction: marketers rank lead quality and MQLs, lead-to-customer conversion rate, ROI, and CAC near the top of their priority list. Those numbers sit closer to revenue and sales readiness than impressions, opens, or clicks.
A useful KPI should have an owner, a target, and a review schedule. “Improve lead quality” is a wish. “Increase MQL-to-SQL rate from 22% to 30% this quarter, owned by demand gen and reviewed every Monday” is a KPI someone can manage without needing a ritual with the analytics team.
The marketing metrics that matter
Group marketing metrics by the job they do in the funnel. Each category answers one question, and each can lie beautifully if you treat it like the whole business.
Acquisition metrics show whether you are generating attention and traffic. They do not prove the traffic is good.
| Metric | Formula | Use it to decide |
|---|---|---|
| Impressions | Platform reported | Whether to expand or narrow reach |
| CTR | Clicks / impressions | Whether creative, titles, or offers need testing |
| CPC | Ad cost / clicks | Whether to shift budget |
| Sessions | Analytics reported | Whether SEO, ads, or content are bringing traffic |
Engagement metrics show interest and behavior. They do not prove revenue impact by default, which is how teams end up worshiping opens like a tiny dashboard cult.
| Metric | Formula | Use it to decide |
|---|---|---|
| Engagement rate | Engaged visits / total visits | Whether content or UX needs work |
| Email CTR | Email clicks / emails delivered | Whether emails or offers need rewriting |
| Time on page | Analytics reported | Whether page structure holds attention |
| Returning visitors | Returning visitors / total visitors | Whether nurture or retargeting is worth building |
Conversion metrics connect traffic to action.
| Metric | Formula | Use it to decide |
|---|---|---|
| Conversion rate | Conversions / visitors | Whether landing pages or offers need fixing |
| Cost per lead | Spend / leads | Whether targeting is too expensive |
| MQL to SQL rate | SQLs / MQLs | Whether scoring matches sales readiness |
| Lead to customer rate | Customers / leads | Whether follow-up is working |
Revenue metrics connect marketing to money.
| Metric | Formula | Use it to decide |
|---|---|---|
| CAC | Sales and marketing cost / new customers | Acquisition limits |
| ROAS | Conversion value / ad cost | Whether to scale or cut ad spend |
| Marketing-sourced revenue | Revenue from marketing-sourced customers | Which channels get funded |
| AOV | Revenue / orders | Bundle or pricing tests |
HubSpot defines CAC as acquisition-related sales and marketing expenses, including ads, tools, salaries, and commissions, divided by new customers in the same period. ROAS is commonly reported as conversion value divided by cost.
Retention metrics show whether the business keeps the value it acquired.
| Metric | Formula | Use it to decide |
|---|---|---|
| Churn rate | Customers lost / starting customers | Onboarding and customer-risk work |
| Repeat purchase rate | Repeat buyers / total buyers | Lifecycle campaigns |
| LTV | ARPU x gross margin / churn | CAC targets |
| Revenue churn | Lost recurring revenue / starting recurring revenue | Which accounts need protection |
For SaaS, a common LTV formula is average revenue per customer x gross margin divided by churn rate. Use it carefully. Stable churn and stable ARPU are doing a lot of work inside that formula.
Choose metrics by business model and decision
There is no universal dashboard. A Shopify store, a B2B consulting firm, a SaaS free trial, and a local service business can all track digital marketing metrics, but they should not use the same weekly report like it came down on stone tablets.
Use this filter:
- Start with the business model.
- Define the main outcome, such as purchases, qualified pipeline, booked calls, or paid accounts.
- Pick 1 to 3 KPIs tied to that outcome.
- Add funnel-stage diagnostics.
- Cut anything nobody uses to make a decision.
| Business type | Primary outcome | KPI focus | Diagnostic metrics |
|---|---|---|---|
| Ecommerce | Purchases, repeat purchases | Conversion rate, AOV, repeat customer rate | Cart abandonment, checkout conversion, revenue by product |
| B2B lead gen | Qualified pipeline | MQL to SQL rate, pipeline value, win rate | Lead source, stage conversion, sales acceptance |
| SaaS free trial | Paid accounts, retained users | Activation rate, trial-to-paid rate, churn | Signup source, PQLs, time to value |
| Local service | Booked jobs | Booked calls, cost per booked job | Form starts, call quality, no-show rate |
Ecommerce benchmarks, like the reported 1% to 4% ecommerce conversion range, can help frame the question. Small teams need numbers that change what they do next.
Use a weekly review to assign decisions
Run the weekly campaign review as a 30-minute meeting, or an async scorecard if your team is tiny and allergic to calendars. Keep it to the marketing lead, channel owners, and analytics owner if you have one.
Use the same cadence every week:
- Check tracking health: UTMs, conversion events, CRM sync, spend imports, and revenue data.
- Review primary KPIs: spend, qualified leads or purchases, conversion rate, CPA or CAC, ROAS, pipeline, or revenue.
- Diagnose supporting metrics: impressions, clicks, CTR, CPC, sessions, bounce rate, frequency, and engagement. They explain movement. They are not the prize.
- Flag changes since last week, especially campaigns 20% above or below plan on spend, volume, or CPA.
- Assign actions, owners, and deadlines in the scorecard, because a metric without an owner becomes dashboard wallpaper.
| Signal | What to check next | Decision |
|---|---|---|
| Spend up, conversions flat | CPA by campaign, search terms, audience | Pause, cap, or move budget |
| CTR up, conversion rate down | Landing page, offer match, lead quality | Revise creative or page |
| CAC up, pipeline quality steady | Close rate, AOV, LTV | Keep testing or narrow targeting |
| Traffic up, leads down | Forms, page speed, source mix | Fix tracking or test page changes |
Paid media is not a set-it-and-forget-it strategy. A live dashboard is nice. A shared spreadsheet is fine if it forces decisions every week.
Use a top-down dashboard layout
Build the dashboard for scanning. Put 4 to 6 top-level KPIs first, with target, trend, and status. Then show funnel diagnostics, such as stage conversion rates and pipeline movement. Then show channel details, such as CAC, ROAS, qualified leads, revenue, or pipeline by source. Put raw platform metrics last.
That hierarchy matches the basic job of a CMO dashboard: show whether marketing is driving efficient growth. Use bold key numbers, clear labels, comparison periods, and enough white space that nobody needs a treasure map.
Impressions, opens, and clicks can diagnose reach, targeting, or creative issues. They should not sit at the top as proof of business success.
Before adding a metric, ask:
- Is it tied to a goal?
- Does it have an owner?
- Is it reviewed on a schedule?
- Would it change a decision?
- Is the data source reliable?
Use statistics and benchmarks as context
If you want source context for the marketing metrics in this guide, ClickMinded’s marketing statistics hub is the next stop. For outside priority data, HubSpot’s 2026 marketing statistics report lists the top metric priorities as lead quality and MQLs at 39%, lead-to-customer conversion rate at 34%, ROI at 31%, CAC at 30%, and lead generation volume at 29%.
Use ClickMinded’s marketing benchmarks hub when you need comparison data, but treat benchmarks like a smoke alarm, not a verdict. A weak benchmark gap tells you where to investigate. It does not automatically tell you to rewrite the strategy, fire the channel, or panic-refresh GA4.
Quick answers for common metrics questions
What are marketing metrics? Quantitative measures of marketing activity, including traffic, leads, CAC, CLV, conversion rate, and NPS.
How are metrics different from KPIs? Metrics are the full data set. KPIs are the few tied to goals like revenue, pipeline, or retention.
Which digital marketing metrics matter most? Start with qualified leads, conversion rate, CAC, ROAS, revenue by channel, CLV, churn, and NPS.
How often should teams review them? Check campaign metrics weekly. Review strategic KPIs monthly or quarterly.
Are impressions, clicks, and opens useful? Yes, for diagnosing reach and message fit. They are inputs, not outcomes.
What should a small business track? Leads, sales, conversion rate, CAC, revenue by channel, repeat purchases, and reviews.
How should I use benchmarks? Compare against your history first, then use marketing benchmarks and marketing statistics for context.