
Use benchmarks as a comparison, not a verdict
“What’s a good conversion rate?”
It is a fair question, but it is impossible to answer well without knowing the offer, channel, audience, page type, funnel stage, and conversion definition.
Marketing benchmarks are useful because they give you a reference point when your own data has no context yet. If your paid search CTR is 1.2%, your demo page converts at 3%, or your email click rate dropped for the third month in a row, benchmark data can help you decide whether you are in normal territory or whether something needs deeper diagnosis.
The danger starts when an average turns into a universal rule. Digital marketing benchmarks are source-dependent, cohort-dependent, channel-dependent, and metric-dependent. A benchmark from SaaS companies using Google Ads has limited value for an ecommerce brand running Meta prospecting. A landing page conversion benchmark from lead gen pages has limited value for a pricing page, a product detail page, or a newsletter signup modal in a sidebar.

Good benchmark sources make the cohort visible. Databox is a useful example because its benchmark framing centers on comparing performance against similar companies, not against The Entire Internet. Its benchmark charts can show the median, 25th and 75th percentile range, your own value, your rank, and the number of contributors in the cohort. Its Benchmark Explorer also lets users filter by industry, business type, employee size, and annual revenue, which is exactly the kind of context an average needs before it deserves a seat at the planning meeting.
Vendor benchmarks can still be useful. They are often based on real platform data, and some are far better documented than random roundup posts. But vendor data is not the same thing as market-wide data. It reflects the customers, tracking setup, definitions, and inclusion rules behind that source. Use it as a directional comparison, then check it against your own GA4, CRM, ad platform, email, and revenue data.
For broader context, pair this guide with our marketing statistics hub and the relevant stats pages for your channel. Use marketing metrics when you need the KPI definition, this page when you need comparison context, and the channel statistics pages when you need source-aware evidence. The goal is to answer “what is a good KPI value?” without assuming one average can explain every audience, offer, funnel stage, and channel.
The main types of marketing benchmarks
A marketing benchmark is a quantified baseline for judging a KPI. That KPI might be CTR, CPA, conversion rate, CPL, ROAS, email click rate, organic traffic growth, or sales-qualified lead rate. The useful version is tied to a source, cohort, channel, and metric definition. The weak version is a random average without enough context.
Panoramata defines a marketing benchmark as a baseline used to measure performance against competitors or industry standards, usually to spot strengths, weaknesses, and opportunities. That definition works, as long as “industry standards” does not get treated as a universal rule.
Common benchmark types include:
- Historical benchmarks compare your current results against your own past performance. Last quarter’s email CTR, last year’s Black Friday CPA, your average demo conversion rate over the previous six months. This is often the cleanest comparison because the business, offer, and tracking setup are yours.
- Industry benchmarks compare your performance against companies in the same category. APQC organizes its marketing key benchmarks by industry and function, which is the right direction because a B2B software company and a local gym should not be graded on the same curve.
- Channel benchmarks compare performance inside a specific channel, such as Paid Search, Paid Social, Organic Search, Email, Display, or Events. Marketing taxonomy frameworks commonly treat channels as top-level reporting categories, because mixing them weakens the comparison.
- Cohort or segment benchmarks compare a defined group against a similar group. New customers versus returning customers. Enterprise accounts versus SMB accounts. Trial users from paid search versus trial users from partner referrals.
- Goal benchmarks compare campaigns with the same job. Lead generation, direct purchase, newsletter signup, webinar registration, retention, and upsell campaigns all behave differently. Oracle’s campaign taxonomy guidance recommends separating campaigns by target audience engagement, audience size, campaign goal, content stream, and seasonality, which is the practical reporting version of “compare campaigns doing the same job.”

Use marketing benchmarks for goal setting, planning, budget checks, and performance diagnosis. Use digital marketing benchmarks to compare channel-specific metrics where tracking is consistent enough to mean something. Treat every benchmark as a question starter, especially when the sample, source, audience, and metric definition are unclear.
Five checks that keep benchmarks honest
Before you use any marketing benchmark, run it through five checks: source, cohort, intent, recency, and metric definition. If one is fuzzy, the benchmark may still be useful, but it moves from “planning input” to “rough context.”
Start with the source. A benchmark from GA4-connected accounts is different from one built from survey responses, ad platform accounts, ecommerce stores, CRM exports, or landing page software. Databox, for example, builds benchmarks from connected data sources such as GA4, Google Search Console, Google Ads, and other tools, then shows aggregate results for participating companies. That is useful, especially because its benchmark groups show anonymized medians, quartiles, lowest and highest values, contributor counts, and your own recent value. It also means the data reflects companies that connected sources and joined those groups. Treat that as a cohort, not the whole market.
Cohort is the second check. Databox lets users filter benchmark groups by industry, company type, employee size, and annual revenue, then load benchmarks for companies that match those parameters. That beats comparing your 12-person B2B services firm to every company with a website. Still, check the contributor count. A median from a narrow cohort can help, but a tiny cohort can swing hard when a few unusual accounts join the sample.

Intent is the third check, and it is where digital marketing benchmarks get messy fast. A visitor from branded search, a retargeting ad, a cold display click, and an email from a customer list may all land on the same page. They did not arrive with the same level of intent. Unbounce frames landing page conversion rate as total conversions divided by total visitors, and its benchmark context calls out that traffic source affects conversion behavior. Keep that in mind before you panic because a cold paid social page converts below an email-driven campaign.
Recency is the fourth check. A benchmark from last month, last quarter, or last year may describe a different market, tracking setup, offer mix, or season. Use data with a clear time window when you can, especially if demand is seasonal, sales cycles are long, or pricing recently changed.
Metric definition is the fifth check. “Conversion rate” can mean demo requests divided by visitors, purchases divided by sessions, leads divided by clicks, or trial starts divided by landing page visitors. Unbounce uses median conversion benchmarks to reduce outlier distortion, which helps, but the formula still has to match your use case. Databox can show cohort medians and quartile ranges, but it does not magically standardize every company’s event setup, attribution window, or conversion definition inside the connected tools.
Use benchmarks that pass all five checks for planning ranges. Use benchmarks that fail one or two checks as directional context. Ignore benchmarks that hide the source, mix cohorts, flatten intent, omit the time window, or leave the metric definition to your imagination.
Benchmark categories to check by channel
Digital marketing benchmarks get easier to use when you sort them by channel first. The main ClickMinded marketing statistics hub is the best starting point because it routes you into channel-specific stats instead of assuming one giant marketing average can explain email, SMS, affiliate, lead gen, landing pages, CRO, and reviews.
Use the channel-specific benchmark guides when you need a narrower comparison set:
| Benchmark guide | Best for |
|---|---|
| Email marketing benchmarks | Open rate, click rate, CTOR, conversion, revenue, unsubscribes, bounces, and list health |
| Email open rate guides | Fast answers for good and average open rates: good email open rate and average email open rate |
| Email click and conversion guides | Fast answers for good email click rate, average email click rate, and email conversion rate |
| Newsletter open rate guides | Newsletter-specific ranges for good newsletter open rate and average newsletter open rate |
| Social media benchmarks | Engagement, reach, follower growth, posting cadence, CTR, and platform-specific reporting caveats |
| B2B marketing benchmarks | Funnel conversion, pipeline, CAC, payback, budget, channel mix, and sales-cycle context |
| Google Ads benchmarks | CTR, CPC, CVR, CPA, CPL, ROAS, impression share, and campaign-type segmentation |
| LinkedIn Ads benchmarks | B2B CTR, CPC, CPM, CPL, lead forms, account engagement, pipeline, and attribution windows |
| SMS marketing benchmarks | Click rate, order rate, revenue per recipient, opt-out rate, deliverability, and consent health |
| Landing page conversion benchmarks | Conversion rates by traffic source, offer type, funnel stage, industry, and conversion definition |
Use the companion statistics pages when you need the source story behind the comparison. The main stats cluster includes digital marketing statistics, email marketing statistics, social media statistics, SEO statistics, content marketing statistics, B2B content marketing statistics, PPC statistics, Google Ads statistics, LinkedIn marketing statistics, B2B marketing statistics, AI marketing statistics, video marketing statistics, and influencer marketing statistics. Statistics explain the evidence. Benchmarks tell you whether a number is high, low, or just normal for the cohort.
For email and newsletters, use the newsletter statistics page for open rate, CTR, CTOR, unsubscribe rate, bounce rate, cadence, and ROI. These are mostly list-health and engagement metrics. The hub cites a cross-industry unsubscribe rate of about 0.22% per send, with under 0.20% treated as excellent, under 0.25% as a reasonable target, and over 0.5% as a warning sign. It also cites opt-in list bounce guidance of under 2% total, with hard bounces around 0.3% to 0.5% and soft bounces around 1% to 1.5%. MailerLite’s 3.6 million campaign dataset reports a median CTOR of 6.81%, while Campaign Monitor guidance puts a healthy CTOR in the 10% to 15% range. Useful, yes, but only after you check list type, industry, cadence, and how the dataset defines CTOR.
For SMS, start with SMS marketing statistics and separate deliverability, opt-out rate, click rate, reply rate, and revenue per message. Promotional SMS, abandoned-cart SMS, and post-purchase SMS should each have their own comparison group. A phone number is a higher-intent signal than a random ad click, and treating those audiences the same makes the report less useful than it looks.
For affiliate, use affiliate marketing statistics to compare commission rate, approval rate, active affiliate share, conversion rate, refund rate, and revenue by partner type. Coupon affiliates, creator partners, review sites, and B2B referral partners do different jobs. Mixing them into one affiliate benchmark turns the dashboard into a blender.
For lead generation, use lead generation statistics and keep the funnel stage attached to the metric. Visitor-to-lead rate, lead-to-MQL rate, MQL-to-SQL rate, cost per lead, cost per qualified lead, and sales cycle length all answer different questions.

For landing pages and CRO, use landing page statistics and conversion rate optimization statistics with extra caution. Unbounce’s landing page benchmark context defines conversion rate as conversions divided by visitors, but traffic source and offer type can swing the number fast.
For reviews, use online reviews statistics to benchmark review volume, average rating, review velocity, response rate, and rating distribution by platform. A local service business, a SaaS company on G2, and an ecommerce brand on product pages need separate cohorts before any average earns your trust.
Judge conversion rates by traffic, offer, and intent
Conversion-rate benchmarks are where useful averages go to get misused in board decks.
Unbounce’s Q4 2024 landing page benchmark reports a 6.6% median conversion rate across about 41,000 landing pages, 464 million visits, and 57 million conversions. That is a solid reference point for landing pages, but it is still a landing page dataset with its own rules. Unbounce filters out tiny samples, removes pages with fewer than 50 visitors or zero conversions, excludes some content categories, and defines conversion rate as desired actions divided by visits in its benchmark methodology.
That 6.6% figure can mislead fast if you use it as a universal target. A SaaS page around a reported 3.8% median and a financial services page around 8.4% may both be normal for their cohorts, even though one looks weak and the other looks strong against the global median.
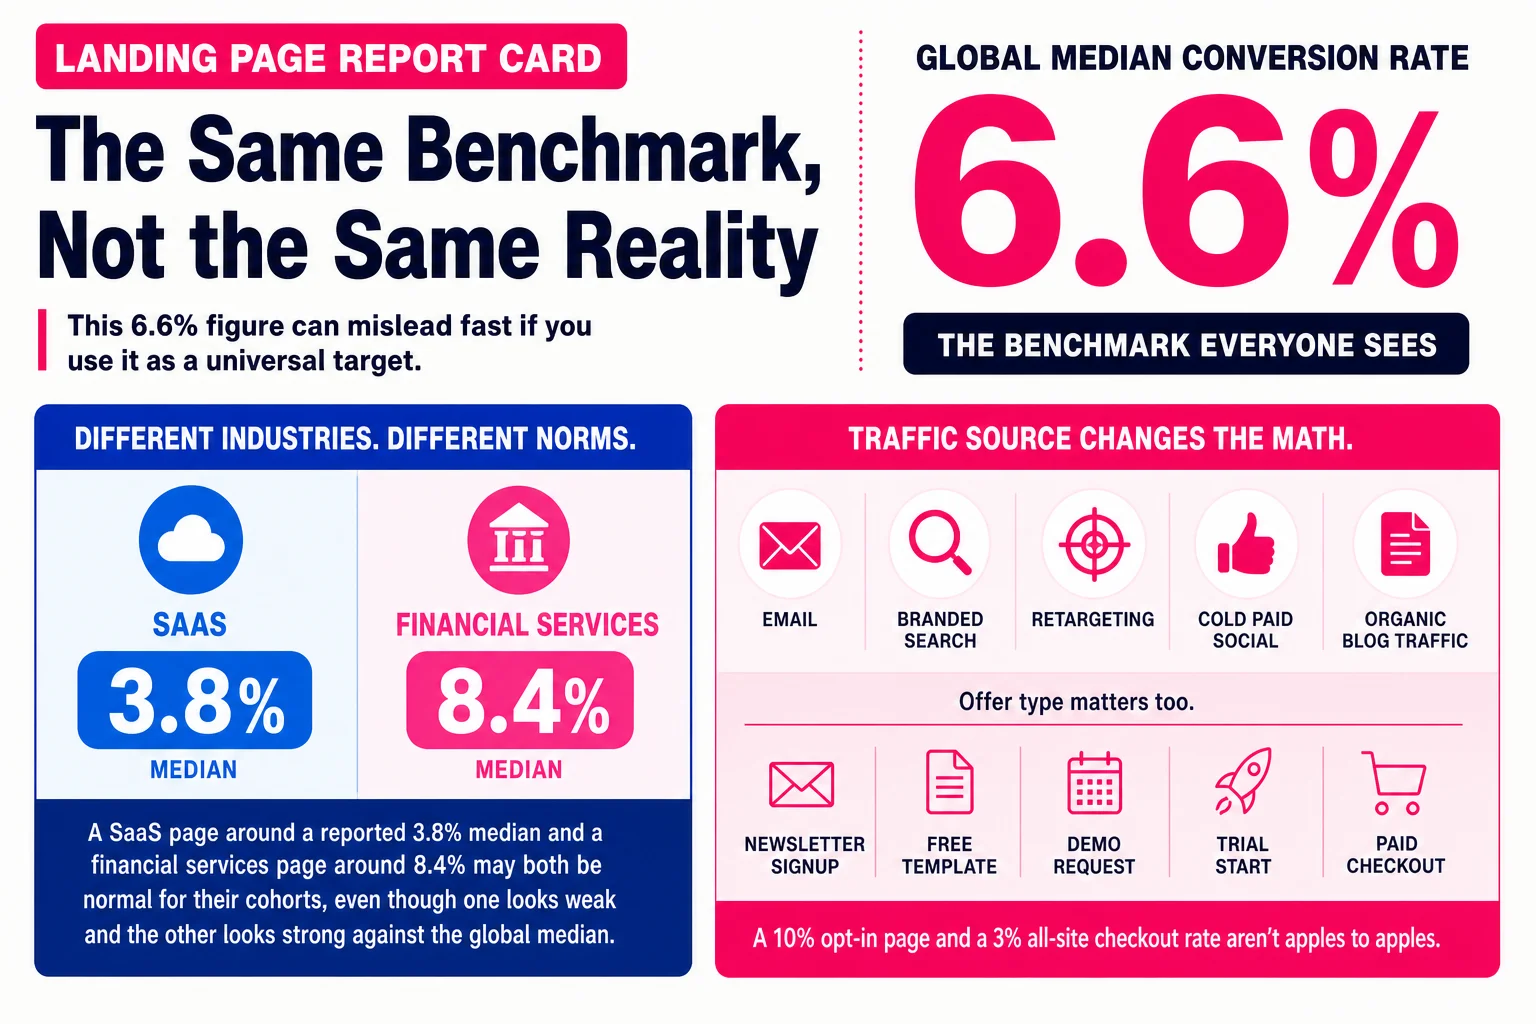
Traffic source also changes the math. Email, branded search, retargeting, cold paid social, and organic blog traffic arrive with different intent. Offer type matters too. A newsletter signup, free template, demo request, trial start, and paid checkout are separate conversion events. A 10% opt-in page and a 3% all-site purchase rate are not competing in the same sport.
Use external conversion benchmarks as a range check, then segment by channel, offer, funnel stage, product type, and source before calling a page good or bad.
Quick answers to common benchmark questions
What are marketing benchmarks? They are comparison ranges for metrics like CTR, conversion rate, CPL, ROAS, open rate, and retention. Good marketing benchmarks come with source, cohort, channel, intent, recency, and metric definition.
What makes a benchmark useful? It compares like with like. Databox-style cohort filtering, such as industry, company type, size, and revenue, is the right instinct because averages get weird fast.
What is a good conversion rate? It depends. Some sources report that most websites convert between 1% and 4%, while landing page datasets like Unbounce can show different medians because the sample is different.
Biggest mistake? Treating vendor benchmarks as market truth. Use external digital marketing benchmarks to sanity-check your internal trend, then segment before making budget calls.