
Use CRO statistics as benchmarks, then build your own tests
Conversion rate optimization statistics are useful when they help you ask better questions. They get dangerous when someone treats them like a vending machine: insert “reviews,” receive 18% more revenue, go home early.
The 2026 CRO statistics pages ranking for this topic tend to mix two very different kinds of numbers. The first kind is a baseline benchmark, like a median conversion rate, an ecommerce average, or a channel average. The second kind is a tactic claim, like user-generated content, reviews, page speed, video, CTA changes, or live chat increasing conversions. Those belong in separate mental buckets.
A benchmark tells you where you sit. A tactic claim gives you a hypothesis to test.
Use this guide alongside marketing statistics for source context, marketing metrics for KPI definitions, and marketing benchmarks for comparison logic. For the closest related pages, see landing page statistics, landing page conversion benchmarks, online reviews statistics, PPC statistics, and Google Ads benchmarks.

For example, some 2026 benchmark roundups cite a median conversion rate around 2.35% and top performers at 11.45% or higher. Other landing page datasets put top-quartile performers above roughly 11.4%. That does not mean your SaaS demo page, Shopify product page, and paid search landing page should all be judged by the same number. Intent, industry, AOV, device mix, offer strength, and traffic source all distort the average.
Ecommerce makes this extra messy. One 2026 benchmark roundup shows ecommerce conversion rates varying across datasets, including 1.70%, 2.66%, 2.96%, and Shopify at 1.4%. ClickMinded’s ecommerce strategy guide puts average ecommerce conversion rates at approximately 2.5% to 3%. Those numbers are close enough to be directionally useful and different enough to make any single “good conversion rate” claim suspicious.
Cart abandonment is the loudest example. A commonly cited 2026 figure puts cart abandonment at about 70.19%, with nearly $260 billion in recoverable annual sales. That supports testing checkout UX, payment options, shipping clarity, reminders, and personalization. It does not prove which fix will work on your store.
Use this page as a working file for /conversion-rate-optimization-statistics/: baseline conversion rate optimization statistics first, tactic claims second, tests always.
Conversion rate optimization statistics: the short version
The clean short version of the CRO statistics is boring in the best way: ecommerce conversion rates usually sit in the low single digits, channel intent changes the number, and tactic claims belong in your testing backlog.
VWO’s ecommerce benchmark page puts most non-social traffic sources in a fairly tight band, with ecommerce conversion rates typically around 2% to 3% for non-social channels. It also cites older external ecommerce averages for context, including Monetate’s Q1 2023 global average of 2.2% and IRP Commerce’s April 2023 figure of 1.82%. Social media is the outlier in that VWO summary, sitting below the 2% to 3% range.
| CRO statistic | What it says | How to use it |
|---|---|---|
| Broad ecommerce context | VWO cites external averages of 2.2% and 1.82% | Use as a sanity check, not a target carved into a stone tablet |
| Non-social ecommerce traffic | Most sources fall around 2% to 3% | Compare similar traffic sources before judging performance |
| Organic search | Included in VWO’s 2% to 3% range | Segment branded vs. non-branded SEO before panicking |
| PPC | Included in VWO’s 2% to 3% range | Judge by query intent, offer, and landing page match |
| Included in VWO’s 2% to 3% range | Separate campaigns, flows, and warm customer lists | |
| Social media | Below the 2% to 3% non-social band | Expect lower rates when intent is colder |
| Tactic claims | Reviews, video, CTAs, live chat, and exit popups show up in CRO roundups | Turn each claim into an A/B test hypothesis |
One caution for anyone collecting conversion rate optimization statistics for a deck: some CRO roundups mention a VWO “3.5% average conversion rate” as a broad benchmark, but the VWO URLs reviewed for this section did not clearly support that exact number with a visible methodology. If you use the 3.5% figure, label it as directional and verify the source before it becomes the number your CEO repeats in a meeting. That is how a spreadsheet becomes office folklore.
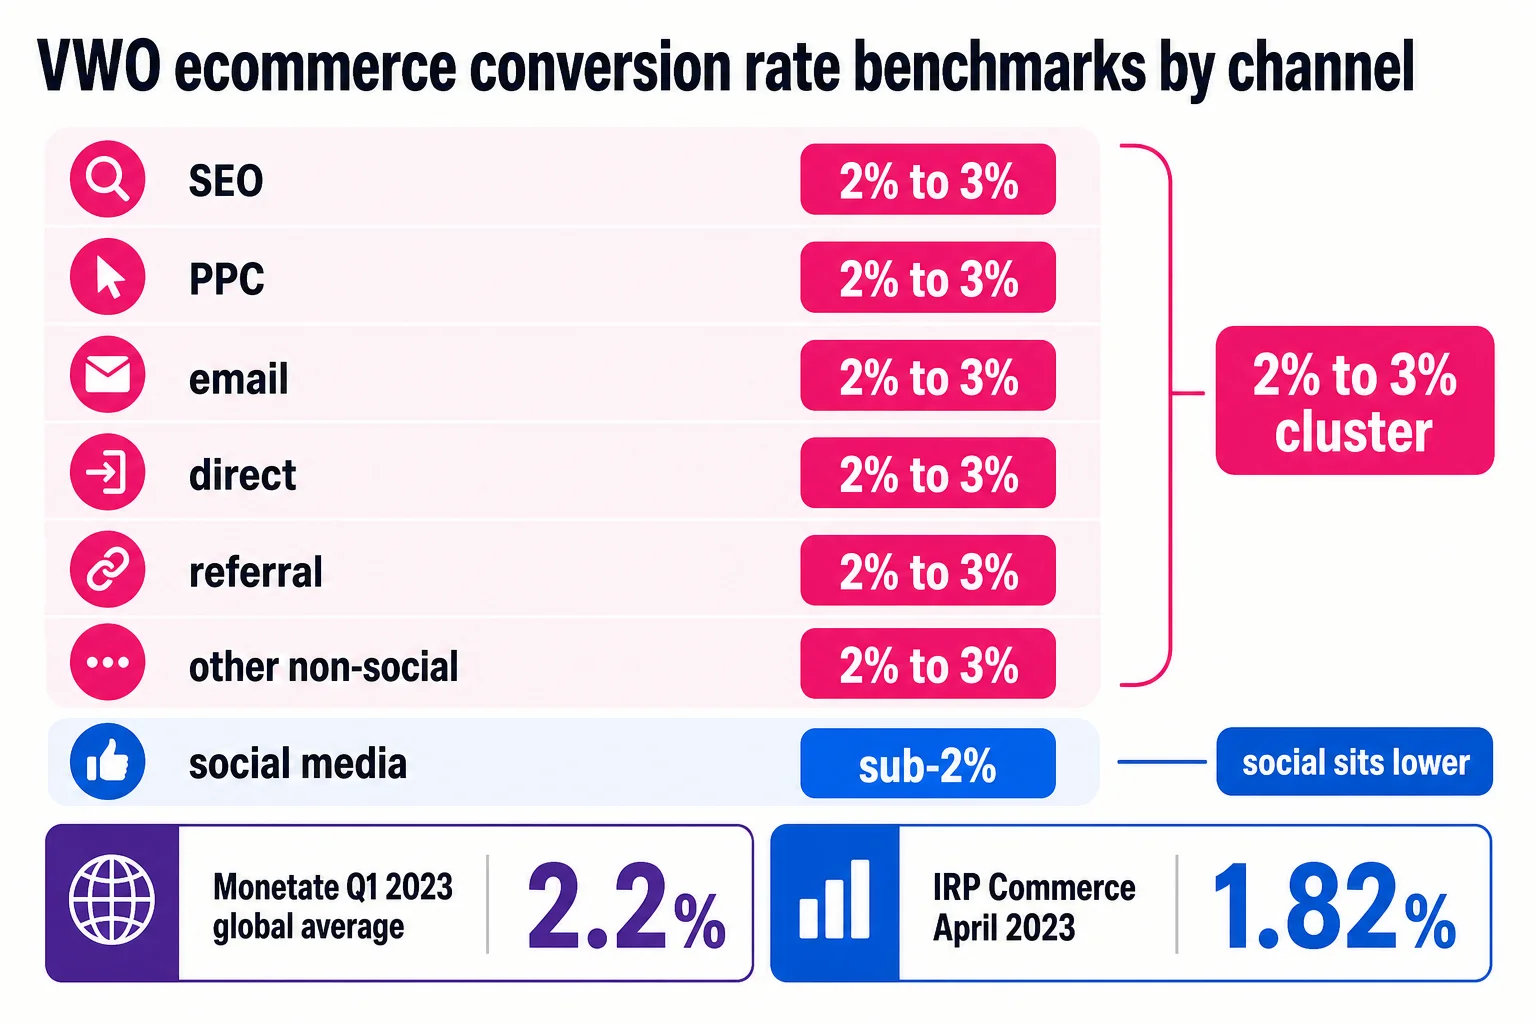
The useful VWO pattern is the channel split. SEO, PPC, email, direct, referral, and other non-social ecommerce traffic tend to cluster around 2% to 3%. Social traffic tends to convert lower because a thumb-stopping Instagram click and a branded Google search are different signals inside the same “session” label.
Tactic stats need a tighter leash. VWO-style CRO statistics roundups often include claims around reviews, product videos, CTA changes, trust elements, live chat, and exit-intent popups. Treat those as prompts. Reviews may reduce anxiety. Video may explain the product faster. Live chat may help shoppers with last-mile questions. A CTA change may clarify the next step. An exit popup may recover some visitors, or it may annoy people who were already annoyed. Beautiful little chaos machine, the internet.
For ClickMinded readers, use benchmark data from the ecommerce marketing strategy guide, SEO strategy guide, digital advertising strategy guide, and email marketing strategy guide to set context by channel. Then use tactic claims as test ideas inside your CRO roadmap, tied to one clear metric and one page type.
Channel benchmarks change when visitor intent changes
A channel benchmark is usually an intent benchmark in disguise.
Someone clicking a referral link from a trusted review site is already halfway down the buying path. Someone clicking a cold social ad between vacation photos and entertainment clips is in a different headspace. Same site, same product, very different conversion rate.
Industry data backs that up. Red Stag Fulfillment reports that, in 2025, referral traffic converted at 5.4% and email at 5.3%, compared with a 1.4% average Shopify store conversion rate. KISSmetrics puts paid search around 2.0% to 3.0% overall, with branded terms higher at 4% to 8% and non-branded terms lower at 1% to 2%. Lucky Orange gives organic search a typical ecommerce range of 2% to 4% when the page matches search intent.
| Channel | Benchmark context | How to read it |
|---|---|---|
| About 5% in cited ecommerce data | Warm audience, existing relationship, stronger intent | |
| Referral | About 5% in cited ecommerce data | Borrowed trust matters |
| Organic search | About 2% to 4% when intent matches | Branded and bottom-funnel terms inflate averages |
| Paid search | About 2% to 3% overall | Branded and non-branded terms need separate rows |
| Organic social | Often lower than search and email | Better for demand creation than blended conversion judging |
| Paid social | Cold traffic often 0.5% to 1.5%; prospecting can be 0.3% to 0.8% | Split cold, warm, and retargeting campaigns |
First Page Sage’s B2B and B2C traffic-source benchmarks show the same broad shape: email tends to sit above SEO, organic social, and PPC/SEM. The exact percentages matter less than the ordering because channel labels hide audience quality.
A partner-email webinar signup, a branded-search demo request, and a retargeting-ad purchase should not be graded against one sitewide average. Segment before you judge. Test inside the segment. Email checkout traffic needs different hypotheses than cold paid social traffic, and your reporting should show that before anyone starts yelling at the homepage.
Landing page benchmarks give CRO teams a cleaner starting point
Landing pages are where CRO gets easier to diagnose because the page has one job. A product page has inventory, navigation, reviews, variants, shipping, and a tiny existential crisis near the size selector. A landing page usually has one offer, one audience, and one conversion goal. Cleaner inputs make the benchmark less mushy.
For more landing page-specific context, see our full list of landing page statistics and landing page conversion benchmarks. The short version: Unbounce’s Q4 2024 benchmark set analyzed 41,000 landing pages, 464 million visits, and 57 million conversions and reported a 6.6% median conversion rate across all industries.
Median matters. Unbounce uses median rather than mean because a few unusually high-performing pages can distort an average. That is useful when you are trying to answer the very normal question, “Is this page broken, or is my boss just comparing it to a webinar signup page from 2019?”
Industry medians in the same 2024 benchmark range from 3.8% to 12.3%, but the conversion goal changes the meaning of the number. A newsletter signup, demo request, insurance quote, and ecommerce purchase do not carry the same friction.
Traffic source still matters inside landing page data. In Finance and Insurance, Unbounce reports median conversion rates of 10.1% for paid search, 9.3% for paid social, and 7.9% for email. That does not create a universal channel ranking. It shows why a landing page benchmark needs industry, offer, channel, and conversion type attached before anyone calls 6.6% “good” or “bad.”
Treat tactic stats as test ideas, not instructions
Tactic statistics are where CRO statistics start getting dangerous. A benchmark says, “Pages like this often convert around here.” A tactic stat says, “Someone added a thing and got a lift.” Those are very different claims, and the second one is how otherwise sensible teams end up copy-pasting a popup, a video, a chat widget, and three testimonial blocks onto the same page like they are decorating a dorm fridge.
Reviews are a good example. VWO recommends using reviews and testimonials on product pages to build trust, and its ecommerce CRO content cites a video-review example with 120.5% higher purchase likelihood, 157.2% more time on site, and 9.1% higher order value. Useful? Yes. Universal? No. That number belongs to a specific test context. Your product category, price point, buyer anxiety, review quality, device mix, and traffic source can all change the outcome.
Landing-page video gets the same treatment. VWO cites Eyeview’s finding that adding video to a landing page can boost conversions by over 86%, with the measured goal tied to clicks on a “Subscribe” button. That is a clean hypothesis: test the page with no video against the page with video. It is a terrible forecast for a high-friction demo request, a $900 product purchase, or a compliance-heavy B2B offer.

The same caveat applies to CTA redesigns, live chat, and popups. CTA wins often include layout changes, reduced distractions, stronger visual focus, or different offer framing, not just “make the button orange.” Chat users can be a higher-intent subset, so conversion multipliers for people who chat should not be applied to every visitor. Popup benchmarks are more useful when they come with a broad dataset, such as Wisepops’ 4.82% average popup conversion rate across 1 billion displays, but even that should be segmented by trigger, offer, page type, and audience.
Use these conversion rate optimization statistics as a backlog, not a checklist. Write the hypothesis, define the segment, choose the metric, run the test, and keep the result tied to the context that produced it.
Common CRO benchmark questions
What is a good conversion rate in 2026? Broadly, many sites sit around 2% to 3%, and a rate above 5% is strong after adjusting for offer, traffic quality, device, and industry. Ecommerce often lands near 2.2% to 2.9%, while some finance and insurance benchmarks run higher.
How do I calculate conversion rate? Use conversions divided by visitors, multiplied by 100. Then segment it. A blended 3% can hide a healthy desktop rate and a wheezing mobile funnel.
Are landing page benchmarks different? Yes. Unbounce publishes industry landing page benchmarks, and other roundups put the broad average near 2.35%, with stronger pages above 5%.
Can I trust tactic stats? Trust them as CRO statistics for hypothesis writing, not forecasting. Reviews, video, CTA changes, and live chat all need your own test data.