
Use landing page benchmarks as baselines, not commandments
A landing page conversion rate only means something after you know three things: the page goal, the traffic source, and the visitor’s intent.
A free template download from branded search can convert beautifully because the visitor already knows what they want. A $12,000 B2B demo request from cold paid social has a much harder job. If both pages get judged against the same “good conversion rate,” someone in the meeting is about to make a very expensive spreadsheet mistake.
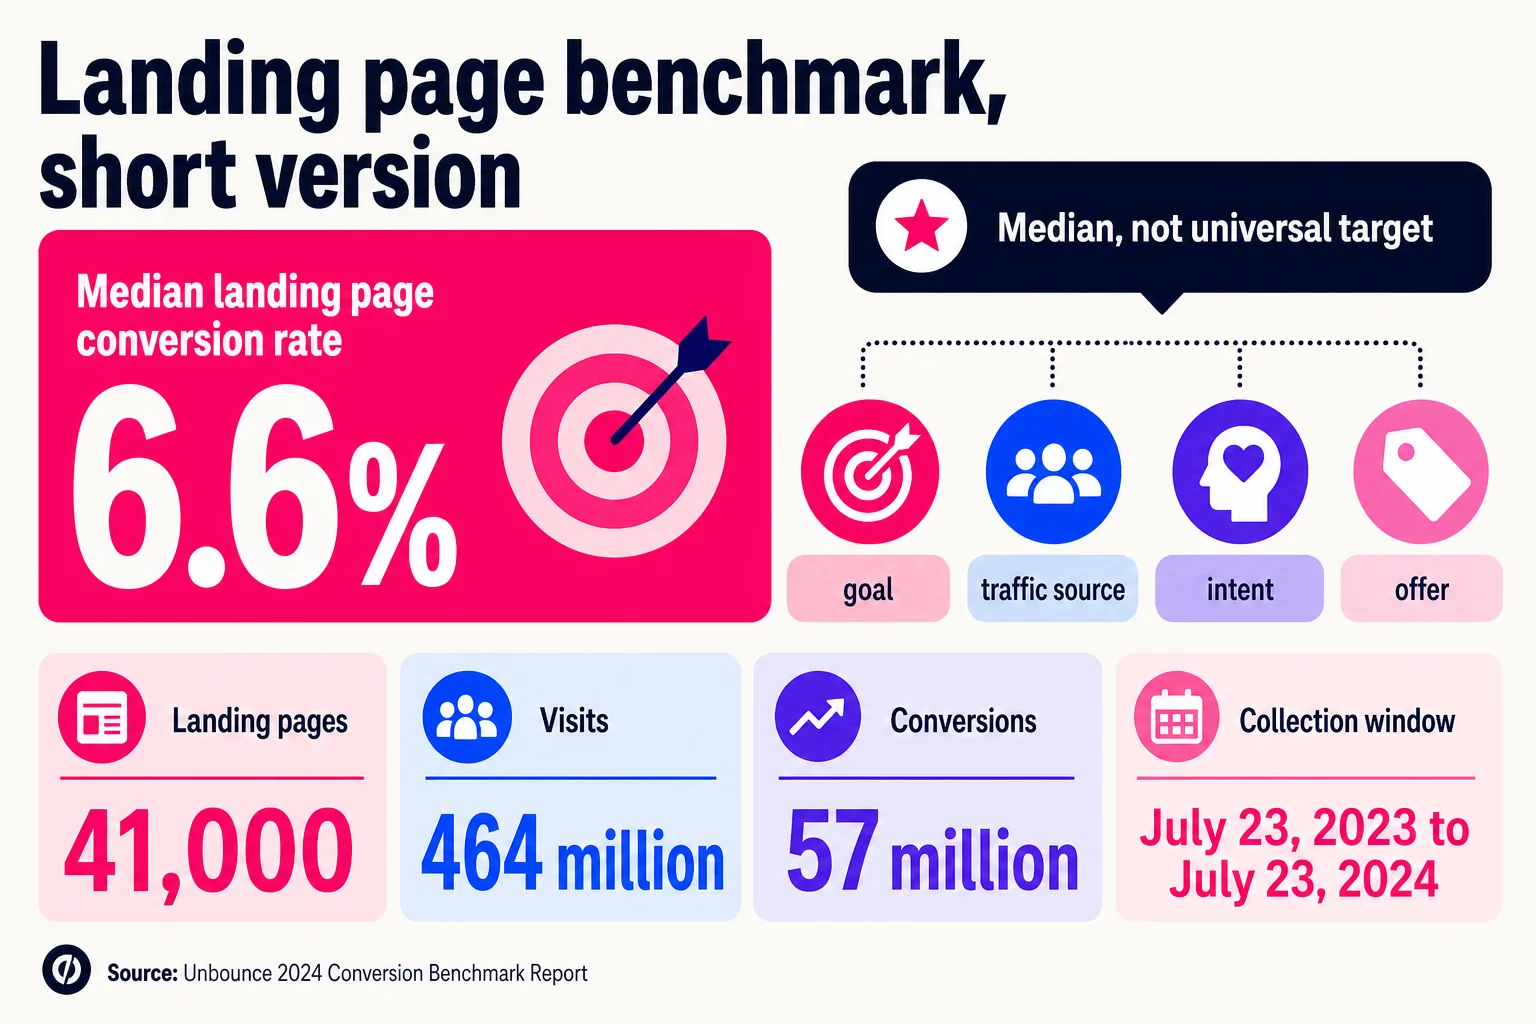
For this /landing-page-statistics/ guide, treat 2026 benchmarks as planning ranges. The Unbounce Q4 2024 landing page dataset is useful because it gives marketers a current baseline, including the widely repeated 6.6% average figure. That number is a starting point, not a universal target. Average and median can tell different stories, especially when a few very high-performing pages pull the mean upward. So if you use 6.6% in a forecast, label it as an average from that dataset, then adjust for industry, offer, channel, and action type.

The same caution applies to VWO landing page stats and testing examples. VWO is useful for seeing which page elements marketers commonly test, including CTAs, navigation, forms, and page variants. But a test result from one page does not become a law of the internet. A one-link page may beat a multi-link page when the visitor has one obvious next step. A multi-link page may work better when the visitor needs comparison, pricing context, or proof before acting.
The cleanest way to use landing page statistics is to map one intent to one page, then measure the action that page is supposed to create. That lines up with the same SEO discipline covered in ClickMinded’s Complete SEO Checklist for 2026: match keyword intent, keep one primary topic per URL, and optimize the page around the job it needs to do.
For the broader cluster, use marketing statistics for source context, marketing metrics for KPI definitions, marketing benchmarks for comparison logic, landing page conversion benchmarks for cohort ranges, and conversion rate optimization statistics when the question moves from “what is normal?” to “what should we test?”
Benchmarks help you plan. Your own segmented data tells you what to fix.
Landing page statistics: the short version
Use the big benchmark numbers as a planning layer before you start arguing about button color like it is a Senate hearing.
| Source | What it measured | Useful stat | How to use it |
|---|---|---|---|
| Unbounce Q4 2024 dataset | 41,000 landing pages, 464 million visits, 57 million conversions | 6.6% median conversion rate across all industries | Use as a baseline, then adjust by page goal, traffic source, and intent |
| Unbounce 2024 Conversion Benchmark Report | Conversion data collected from July 23, 2023, to July 23, 2024 | 6.6% all-industry median | Treat as a benchmark median, not proof your page “should” convert at 6.6% |
| VWO landing page stats and testing examples | Landing page optimization patterns and A/B testing examples | Navigation, CTA, form, visual hierarchy, and page experience changes can affect conversion | Use for test ideas, not guaranteed lift forecasts |
| HubSpot-cited landing page count research, via secondary summaries | Companies grouped by number of landing pages | Moving from fewer than 10 to 10 to 15 landing pages is often cited with a 55% lead lift | Treat as correlation. More pages help when they match distinct audiences, offers, and channels |
The Unbounce number is the cleanest benchmark here because the sample is large and the method is clear enough to understand the shape of the data. The repeated 6.6% figure comes from a large landing page dataset, but Unbounce frames it as a median. Some roundup posts call it an average. That wording matters because a mean and a median can tell different stories when conversion rates are lumpy, and landing pages are absolutely lumpy. One webinar page from warm email traffic can make a cold paid social demo page look like it forgot how to walk.
VWO’s landing page material is better for deciding what to test than for setting one universal target. Their examples point to familiar CRO pressure points: one primary CTA, fewer distractions, shorter or better-sequenced forms, clearer visual hierarchy, and page variants built for specific traffic. The one-link versus multi-link debate belongs here too. A one-link page can work when the visitor has one obvious action, like “download the guide” or “start trial.” A multi-link page can make sense when visitors need pricing, examples, reviews, or technical proof first.
The “more landing pages equals more leads” stat needs adult supervision. The 10 to 15 landing pages lift is often cited as about 55% more leads for companies moving out of the “fewer than 10 pages” bucket. That does not mean publishing five bland pages with swapped city names will magically create 55% more pipeline. Companies with more pages often have more campaigns, more audience segments, better offers, and more traffic. The pages may be a sign of a stronger system.
For a 2026 forecast, put 6.6% in the baseline column, then build ranges around the page’s job. A high-intent Google Ads landing page for a narrow offer should be judged differently from an ecommerce sale page, a founder-led waitlist page, or an enterprise demo page. If paid search is part of the plan, pair this with ClickMinded’s Google Ads checklist so the ad promise, keyword, and landing page stay aligned.
A good conversion rate depends on the job of the page
A good landing page conversion rate starts with the action you are asking for. A newsletter signup, a webinar registration, a demo request, an ecommerce purchase, and a local quote request all carry different levels of effort, trust, and buying intent.
Use the 6.6% median from Unbounce’s Q4 2024 dataset as a rough planning baseline, then immediately adjust it by goal, traffic source, and intent. The dataset is big, 57 million conversions across 41,000 landing pages, but the median matters. A few unusually strong pages can pull an average upward, while the median gives a cleaner read on typical page performance.
A newsletter signup from a warm audience may beat 6.6% without doing anything magical. The ask is small. A webinar page can also convert well when the topic matches a current pain and the traffic comes from email, retargeting, or a trusted partner. A SaaS free-trial page often sits in a higher-intent bucket, with 2026 benchmark roundups commonly putting free-trial landing pages around 7% to 10%, but that range makes more sense for visitors who already understand the category.
Demo pages are trickier. A 4% demo-request rate from cold paid social may be healthy if the product is expensive and the visitor needs sales education. A 4% demo-request rate from branded search may be a warning light. Same number, different story.
Ecommerce pages usually deserve their own yardstick. Product pages often convert closer to 2% to 4%, because the visitor has to compare price, shipping, trust, reviews, and timing before buying. Local quote pages can beat broader benchmarks when the query has urgency, like “emergency plumber near me,” but they can lag when the offer is vague or the service is high-ticket.
Treat 10% or above as strong for high-intent landing pages, especially from search, email, or retargeting. Treat it as a clue, not a law. For lower-intent traffic, a lower conversion rate can still be profitable if cost per lead, lead quality, and close rate work.
Fewer links usually mean a cleaner decision
A landing page has one job, so every extra link should have to earn its rent. Top navigation, footer links, social icons, secondary CTAs, “learn more” buttons, blog links, pricing links, and the tiny “follow us on LinkedIn” icon all give visitors a way to leave the path you paid to put them on.
The benchmark direction is pretty consistent. VWO’s landing page stats roundup, citing ZoomInfo data, reports that pages with just one link convert at 13.5%, compared with 10.5% for pages with 5 or more links. That is a 3 percentage-point gap, which is not tiny if you are buying traffic at scale.
HubSpot’s navigation tests point the same way, with conversion lifts on all five tested landing pages after removing navigation and external links. The effect was smaller on top-of-funnel pages, around 0% to 4%, and larger on mid-funnel pages, including 16% and 28% lifts. VWO’s Yuppiechef case study is the more dramatic version, where removing the navigation menu doubled signups from about 3% to 6%.

Use the pattern carefully. A cold visitor from paid social may need a proof link, reviews, or a product tour before they feel safe clicking. A branded-search visitor looking for a demo probably does not need seven exits. Pick one primary CTA, match it to the ad and offer, and demote anything that competes with that action.
Track the friction before you pick the test
Conversion rate is the headline metric, but it is too blunt on its own. Measure it as primary goal completions divided by visitors, then segment it by page goal, traffic source, and intent. A demo page from branded search, a coupon page from paid social, and an SEO lead magnet should not share the same target just because they all live in the same dashboard.
Use the supporting metrics to find the leak. Bounce rate tells you how many visitors leave after viewing only the landing page without interacting. CTA click-through rate separates interest from completion. If CTA clicks are low, test the offer, button copy, above-the-fold message, proof, or page speed. If CTA clicks are high but conversions are low, look at the form, checkout, calendar step, or whatever comes after the click.
Form completion and abandonment deserve their own view. High abandonment usually points to too many fields, unclear labels, scary required fields, bad mobile UX, or error messages written by someone who has never felt joy. HubSpot’s analysis of more than 40,000 landing pages found that conversion rates decrease as form fields increase, with multiple text areas and dropdowns tied to lower conversion rates. Start there before testing the button shade of blue again.

Round out the dashboard with cost per conversion, source conversion rate, device performance, average time on page, scroll depth, return versus new visitors, and downstream lead quality. Lead quality matters because a page that doubles ebook downloads while filling sales’ calendar with wrong-fit contacts has not improved the business.
Prioritize fixes with PIE when choosing which page or funnel section to work on first: potential, importance, and ease. Use ICE when ranking specific test ideas: impact, confidence, and ease. For example, “shorten the demo form from nine fields to five” probably beats “rewrite the hero eyebrow copy” if mobile form abandonment is ugly.
For A/B tests, pre-calculate sample size from your current baseline and minimum detectable effect, pick one primary metric, keep variants limited, check traffic splits, avoid peeking, and run the test across a representative window that covers weekday, weekend, campaign, and promo effects. A clean test beats a fast test that lies politely.
Common landing page benchmark questions
What is the average landing page conversion rate? Use Unbounce’s 6.6% median conversion rate from its Q4 2024 dataset: 41,000 pages, 464 million visitors, and 57 million conversions. Segment by goal, traffic source, and intent.
What is a good landing page conversion rate? Benchmark roundups often put “good” around 2% to 5%, with top-quartile pages above 11%. Your cold SaaS demo page probably will not behave like a warm coupon page.
How many landing pages should we have? Specific pages usually beat one generic page. The 10 to 15 page lift is useful directionally, but methods vary.
Should landing pages have navigation? For campaign pages, use one primary CTA. VWO’s landing page stats support reducing distractions.