
SMS marketing statistics need a measurement reality check first
SMS gets attention. That part is real. But before using sms marketing statistics in a forecast, board deck, or “we should totally add texts because look at this chart” Slack thread, the famous 98% SMS open rate needs a giant caution sticker.
Standard SMS does not work like email. Email platforms can estimate opens when a tracking pixel loads. SMS has no equivalent pixel, embedded image, or script that fires when someone views a message. Many SMS tools can track delivery, clicks, replies, conversions, opt-outs, and revenue events, but they often cannot measure a true open at the individual message level. Reported SMS open rates are usually inferred from delivery confirmations, response behavior, clicks, replies, and sometimes lock-screen behavior rather than a direct technical open signal.
So when you see “98% open rate” on an SMS marketing stats page, treat it as an inferred reach benchmark, not a universal law of physics. It may be directionally useful. It may also be recycled from vendor copy, stripped of context, and polished until it looks more precise than it is. The marketing internet does this a lot. Somewhere, a spreadsheet loses a column called “source notes” and a confident claim is born.
This post is a cleaned-up meta-compilation of SMS marketing benchmarks, text message marketing statistics, and business texting statistics for marketers who need usable ranges instead of vendor-friendly fog machines. We will separate transactional SMS, promotional SMS, and ecommerce SMS where the data allows it, because a shipping alert, a two-factor authentication code, and a “20% off until midnight” blast are not the same thing wearing different hats.
We will also avoid the lazy channel-war framing. SMS can beat email on immediacy and visibility in some contexts. Email can beat SMS on cost, depth, creative space, and tolerance for frequency. Paid ads, push, social, direct mail, and sales outreach all have their own jobs. If you want email context while reading this, use newsletter statistics, email marketing statistics, and email marketing benchmarks for comparison.
For the wider measurement system, keep this page beside the marketing statistics hub, marketing metrics, marketing benchmarks, and the dedicated SMS marketing benchmarks guide.
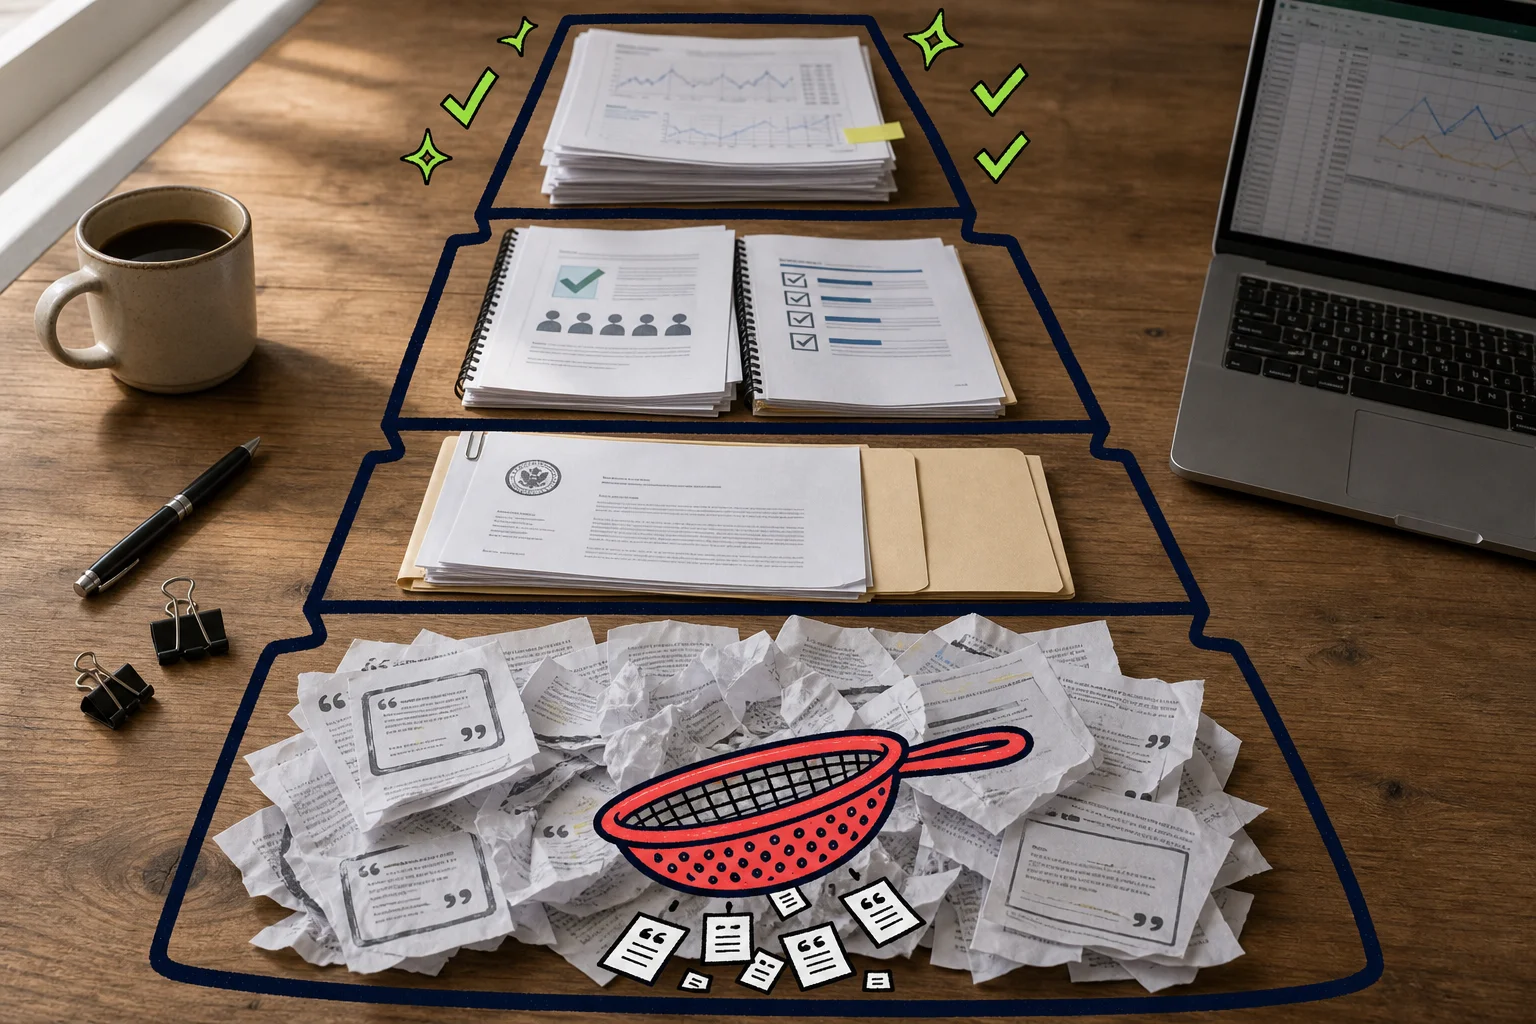
We sorted sources by how useful they are for actual marketing decisions. First-party platform benchmark data gets the most weight when the platform explains the dataset, timeframe, audience, and metric definitions. Klaviyo, Postscript, Omnisend, Infobip, MessageFlow, and similar platforms can see real campaign behavior, but their data reflects their customer base. Ecommerce-heavy SMS data should not be blindly applied to B2B appointment reminders or local-service follow-ups.
Named survey data helps with consumer preference questions, such as whether people want shipping updates, appointment reminders, promo codes, or brand texts. It tells you what people say they prefer, which is useful, but it is still different from observed campaign behavior.
Official and legal resources matter when discussing consent, opt-outs, carrier registration, deliverability, and regulatory basics. This article does not give legal advice, but compliance context can affect performance numbers.
Recycled secondary claims get the least trust, especially roundup posts that repeat “98% open rate,” “45% response rate,” or giant SMS ROI numbers without explaining whether the data came from a platform report, survey, narrow case study, or another roundup that copied another roundup.
Use SMS open-rate figures as a high-level signal that texts are highly visible. Use clicks, replies, conversions, revenue per recipient, opt-out rate, and unsubscribe behavior to decide whether your SMS program is working.
SMS marketing statistics: the short version
Use this as the executive skim. There is no one magic SMS number. Some stats help you plan; some deserve the same suspicion you reserve for a restaurant menu with 19 fonts.
| Statistic | Best-use interpretation | Source/context and caveat |
|---|---|---|
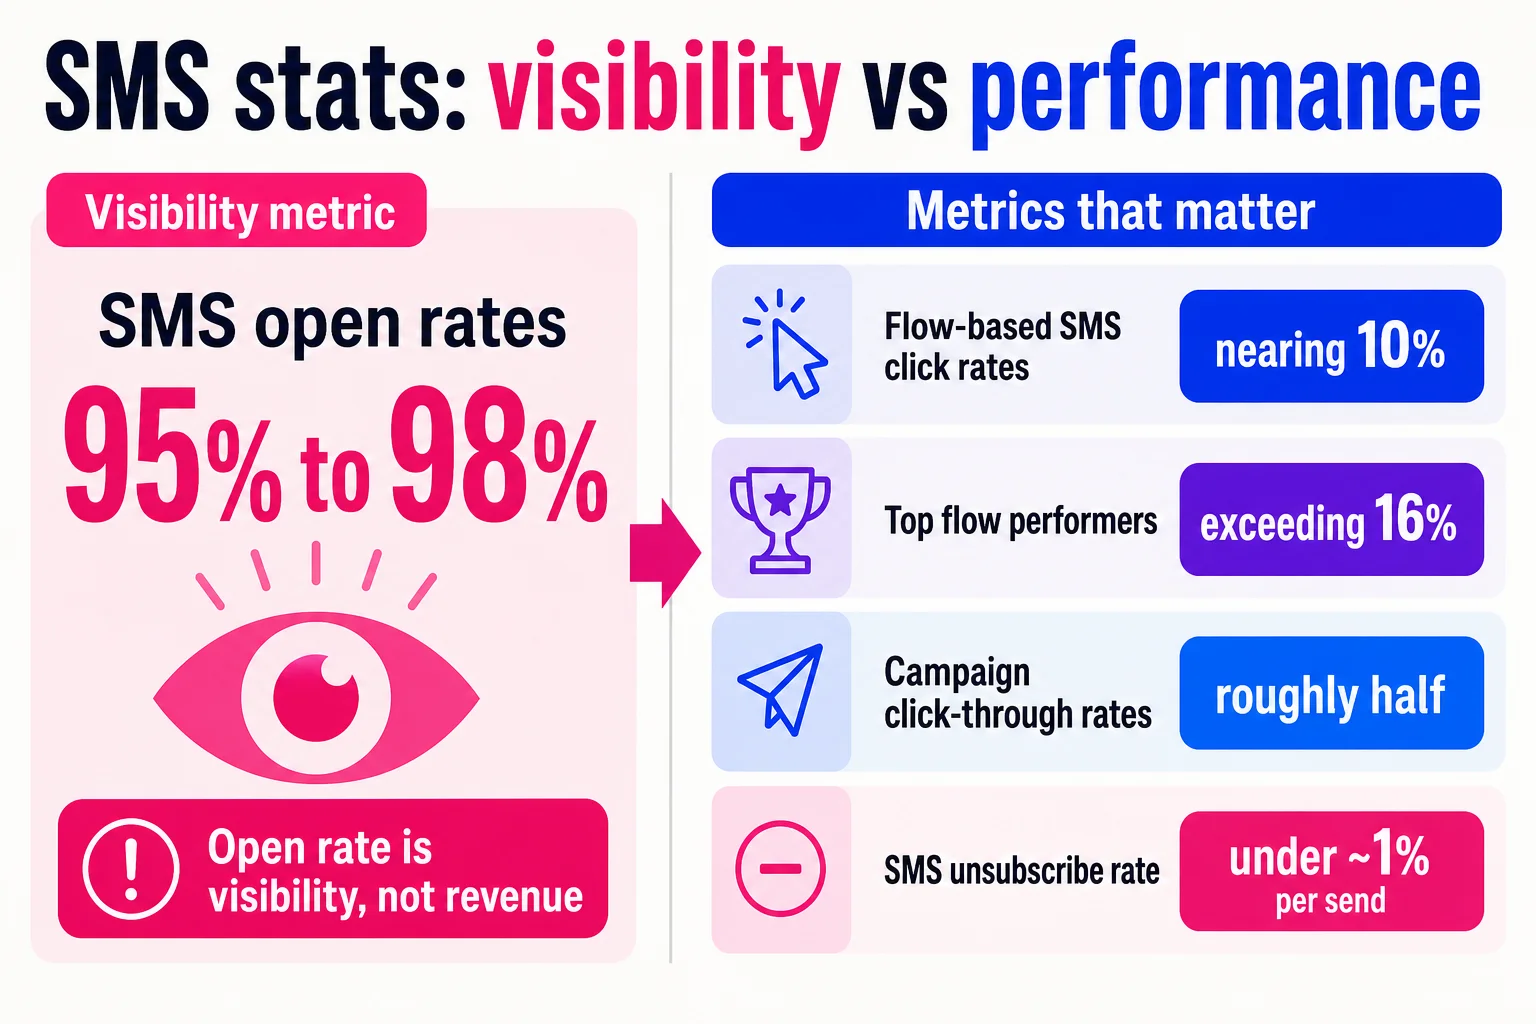
| SMS open rates are often cited around 95% to 98% | Treat this as visibility, not revenue | Klaviyo-derived 2026 benchmarks summarized by Stimulate cite open rates around 95%. The older 98% claim gets recycled across vendor pages. Standard SMS opens are not measured like email opens, so do not treat this as precise. |
| Flow-based SMS click rates can approach 10%, with top performers above 16% | Automated texts usually beat blasts because timing and intent are better | Klaviyo reports flow-based SMS click rates near 10%. That reflects Klaviyo customers and Klaviyo’s definitions. |
| SMS campaign click rates are roughly half of flow click rates | Promotional sends need stronger segmentation and offers | Same Klaviyo benchmark context. “Campaign” can mean a sale blast, VIP drop, back-in-stock alert, or “please buy this random thing,” which is not a scientific category, sadly. |
| Ecommerce SMS CTR often lands around 9% to 14% | Plan around high single digits to low teens | Stimulate’s Klaviyo-derived ranges show Apparel at 11% to 13% CTR, Food and Beverage at 12% to 14%, and Home Goods at 9% to 11%. Verify definitions before forecasting. |
| SMS conversion rates often range from about 1% to 3% | Use this to judge whether clicks become orders | Stimulate lists Apparel at 1.0% to 2.0%, Beauty at 1.5% to 2.0%, and Food and Beverage at 2.0% to 3.0%. Attribution windows can move this number a lot. |
| SMS unsubscribes are commonly under 1% per send | Healthy sends should lose only a small slice of the list | Klaviyo-derived ranges show many verticals around 0.5% to 0.9% unsubscribes. Low opt-outs after barely sending anything prove very little. |
| Apparel SMS revenue per recipient ranges from $0.66 to $2.42 | Revenue per recipient is better for ROI than open rate | Stimulate lists Apparel and Accessories at $0.66 to $2.42 RPR. Price, margin, discounts, attribution, and list quality all matter. |
| Abandoned-cart SMS can earn far more per message than standard campaigns | Cart recovery is one of the clearest ecommerce SMS use cases | Postscript covers abandoned-cart SMS performance across 17,000+ Shopify stores. A secondary ecommerce summary cites $3.52 to $10.95 per message sent, so treat that dollar range as directional unless you verify the method. |
| Median cadence is about 1.91 messages per subscriber per month | Cadence belongs in the benchmark, not a forgotten settings tab | Postscript reports about 1.91 messages per subscriber per month, with higher percentiles near 3.84 and 6.65. More sends can lift short-term revenue and still train people to leave. |
| Average email click rate is 1.69%, with top performers at 3.38% | SMS often gets higher clicks, but email still wins on cost and frequency | Klaviyo reports a 1.69% average email click rate. Compare SMS with email carefully, including broader newsletter statistics. |
Practical SMS benchmark ranges for planning and diagnosis
A useful SMS benchmark starts with the job of the message. A flash-sale blast, an abandoned-cart reminder, a shipping alert, and a customer-service text should not be graded on the same curve. That is how teams mistake a normal promo for a disaster, or a high-intent flow for proof that every text will print money forever.
Use these as planning ranges, not laws of physics. The sources mix ecommerce platform data, vendor benchmarks, and agency guidance, so definitions vary.
| Metric | Practical range | Better-than-average signal | Caveat |
|---|---|---|---|
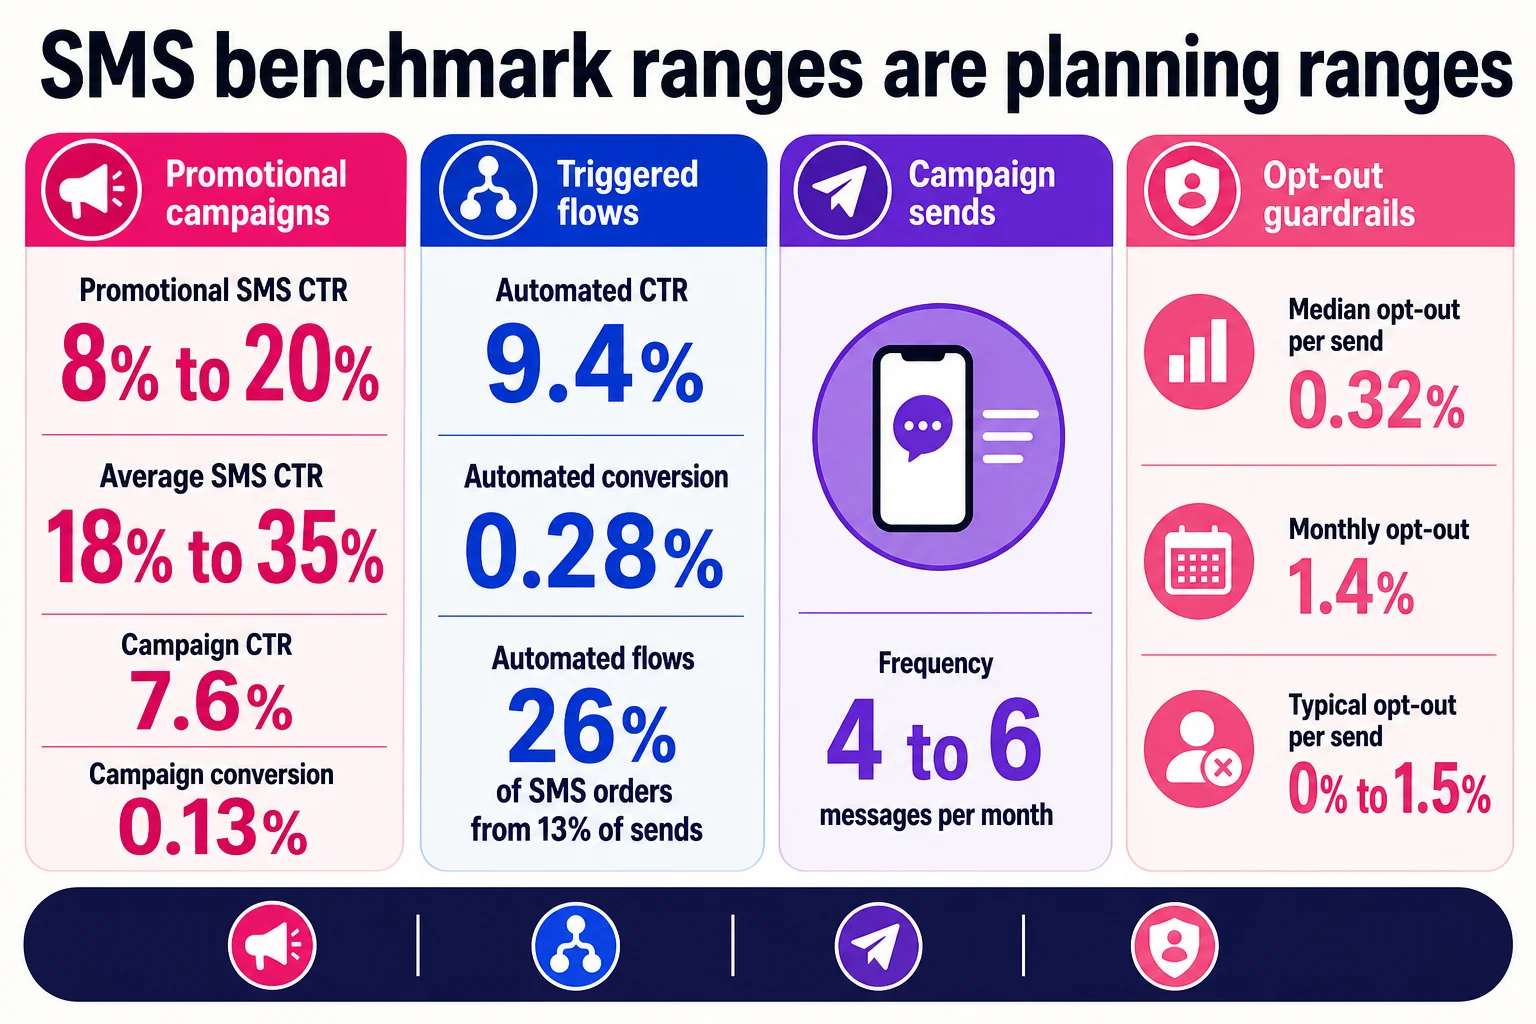
| Promotional SMS click-through rate | 8% to 20% | 20%+ on segmented promos or strong offers | PushOwl gives 8% to 20% as a promotional SMS CTR range. Sakari reports 18% to 35% average SMS CTRs, but that may mix message types. |
| Automated SMS click-through rate | 9% to 16%+ | Flows beat campaigns | Omnisend reports 9.4% click rate for automated SMS, versus 7.6% for campaigns. Platform mix matters. |
| SMS conversion rate, orders per message sent | 0.1% to 0.5% | 0.5%+ for automated ecommerce flows | Omnisend reports 0.13% conversion for campaigns and 0.28% for automated SMS. That means attributed orders divided by messages sent, not conversion per click. |
| SMS conversion rate by engaged traffic | 5% to 30% | 20%+ on bottom-funnel triggers | Sakari reports 21% to 30% conversion rates for well-optimized SMS programs. Treat this as directional unless you know the denominator: sends, clicks, sessions, replies, or qualified conversations. |
| Opt-out rate | 0% to 1.5% per send | Under 0.5% at regular cadence | Sakari reports opt-outs often between 0% and 1.5% per send and below 3.5% on average. One timid send per quarter can make almost any list look healthy. |
| Opt-out rate at monthly cadence | Around 0.3% per send, 1% to 2% monthly | Stable churn while revenue per recipient holds | Digital Applied reports that 4 to 6 messages per month produces a 0.32% median opt-out rate per send and 1.4% monthly opt-out rate, with opt-outs rising at 8+ messages per month. |
| Revenue per recipient or message | Often under $1 for broad promos, higher for cart and high-intent flows | $1+ per recipient on campaigns, several dollars per message on cart recovery | This swings with AOV, margin, attribution window, discounts, and MMS costs. Omnisend reported over $33 million in SMS sales for merchants in 2023, but aggregate sales will not tell you your per-send economics. |
| Reply or response rate | Low single digits for most promos, higher for support or conversational SMS | Replies that lead to purchases, saved orders, or resolved issues | Treat unsupported “45% response rate” claims as weak unless the source defines response, audience, and message type. |
| Response time | Minutes for staffed support, near-instant for automated transactional replies | Most replies handled within the promised service window | Public benchmark data is thinner here, so use your own SLA and missed-reply rate. |
For forecasting, start conservative: high single-digit CTR for broad promotional SMS, low double-digit CTR for strong segments or flows, and orders-per-send conversion under 0.5% unless your own data says otherwise. If a vendor pitch assumes 30% CTR, 25% conversion, and almost no unsubscribes on every blast, the spreadsheet has entered fan fiction territory.
For diagnosis, follow the leak. Weak CTR points to the offer, audience, timing, or link promise. Strong CTR with weak conversion points to the landing page, checkout, inventory, price, or attribution setup. Good revenue with spiking opt-outs means you may be buying this month’s sales with next month’s list.
SMS reach is broad, but opt-in is the real gate
SMS starts with a reach advantage. In the U.S., Pew Research Center’s mobile research shows that smartphone ownership is now high enough for texting to be treated as a mainstream customer communication channel, rather than a niche tactic for younger buyers or mobile-first brands. That is the boring but useful foundation behind a lot of sms marketing stats: the channel sits on behavior people already have.
The mistake is jumping from “people text” to “people want marketing texts from every company they have ever bought from.” Consumer texting behavior and marketing opt-in behavior are different things. One is a habit. The other is permission.
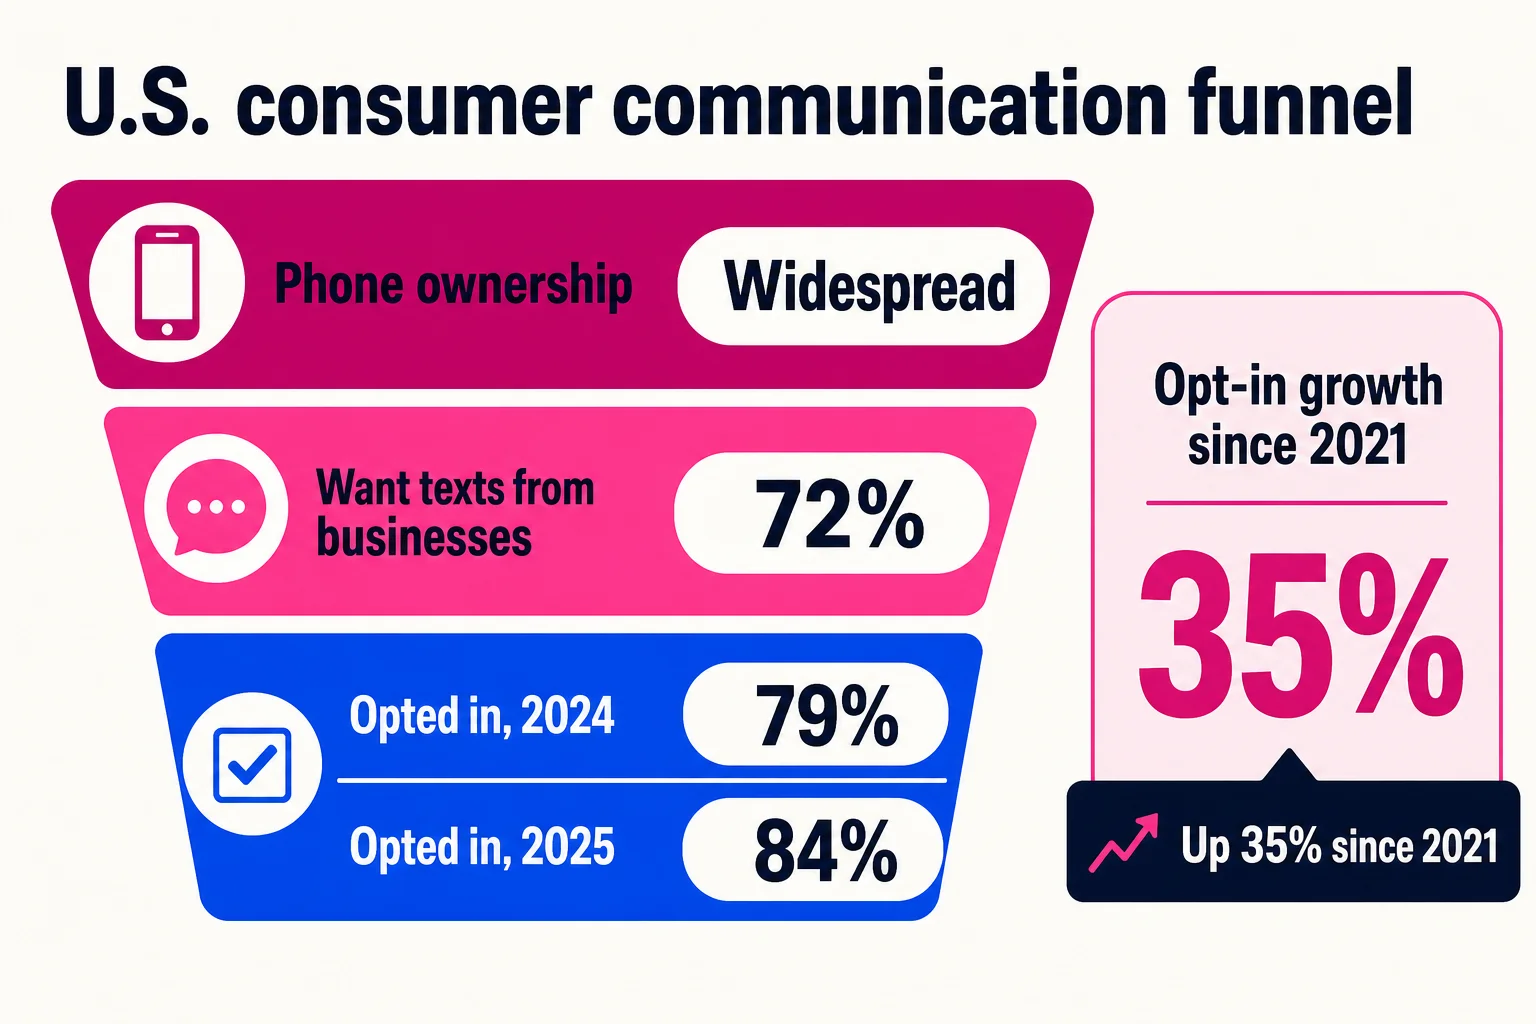
Business texting statistics are still strong, but they mostly come from vendor surveys and industry reports, so treat the exact percentages as directional. Text Request’s 2025 report says 72% of consumers want to receive texts from businesses and organizations. SimpleTexting reports that 84% of consumers are opted in to receive texts from businesses in 2025, up 35% since 2021. ElectroIQ reports a similar trend, with 79% of consumers opted in during 2024, up from 71% in 2023. Those figures support the same broad point: business texting has moved into normal customer communication.
The strongest use cases are practical, not magical. Text Request reports that businesses use texting most often for customer service at 76%, appointment scheduling at 70%, and alerts or notifications at 61%. That matters because those messages match why people tolerate texts from brands: speed, usefulness, and low friction.
SMS reach gives marketers a large addressable channel. It does not give them a free pass to text everyone about every coupon, restock, webinar, launch, survey, apology tour, and “quick reminder” the CRM team can invent before lunch.
People want useful texts, not a coupon cannon
SMS performance depends on the kind of message people think they signed up for. A text about a delayed delivery feels helpful. A text about 12% off socks at 8:47 p.m. feels different, unless the customer explicitly asked for that sort of thing and the offer is actually good.
For this article, the categories matter:
Transactional SMS covers functional updates tied to an account, purchase, booking, payment, security event, or delivery. Think one-time passwords, fraud alerts, shipping confirmations, appointment reminders, and payment reminders.
Promotional SMS means sales-oriented messages that, as Twilio puts it, “prompt the recipient to make a purchase or take another action,” including coupons, flash sales, and campaign pushes.
Ecommerce SMS sits between those two. It can include transactional order updates, promotional drops, back-in-stock alerts, loyalty messages, replenishment reminders, and abandoned-cart flows.
Lifecycle or triggered SMS is behavior-based messaging, such as a cart reminder, post-purchase check-in, subscription reminder, or winback message.
Business and customer-service texting includes two-way conversations for support, scheduling, estimates, confirmations, and follow-up.
That separation is where a lot of text message marketing statistics get cleaner. Twilio’s communications research points SMS and similar real-time channels toward high-urgency, short messages like fraud alerts, account notifications, appointment reminders, payment reminders, order updates, and delivery notifications. Sinch reports that 76% of consumers opt in to receive SMS for appointment or reservation reminders, which fits the same pattern: people like texts when the message saves time or prevents a problem.
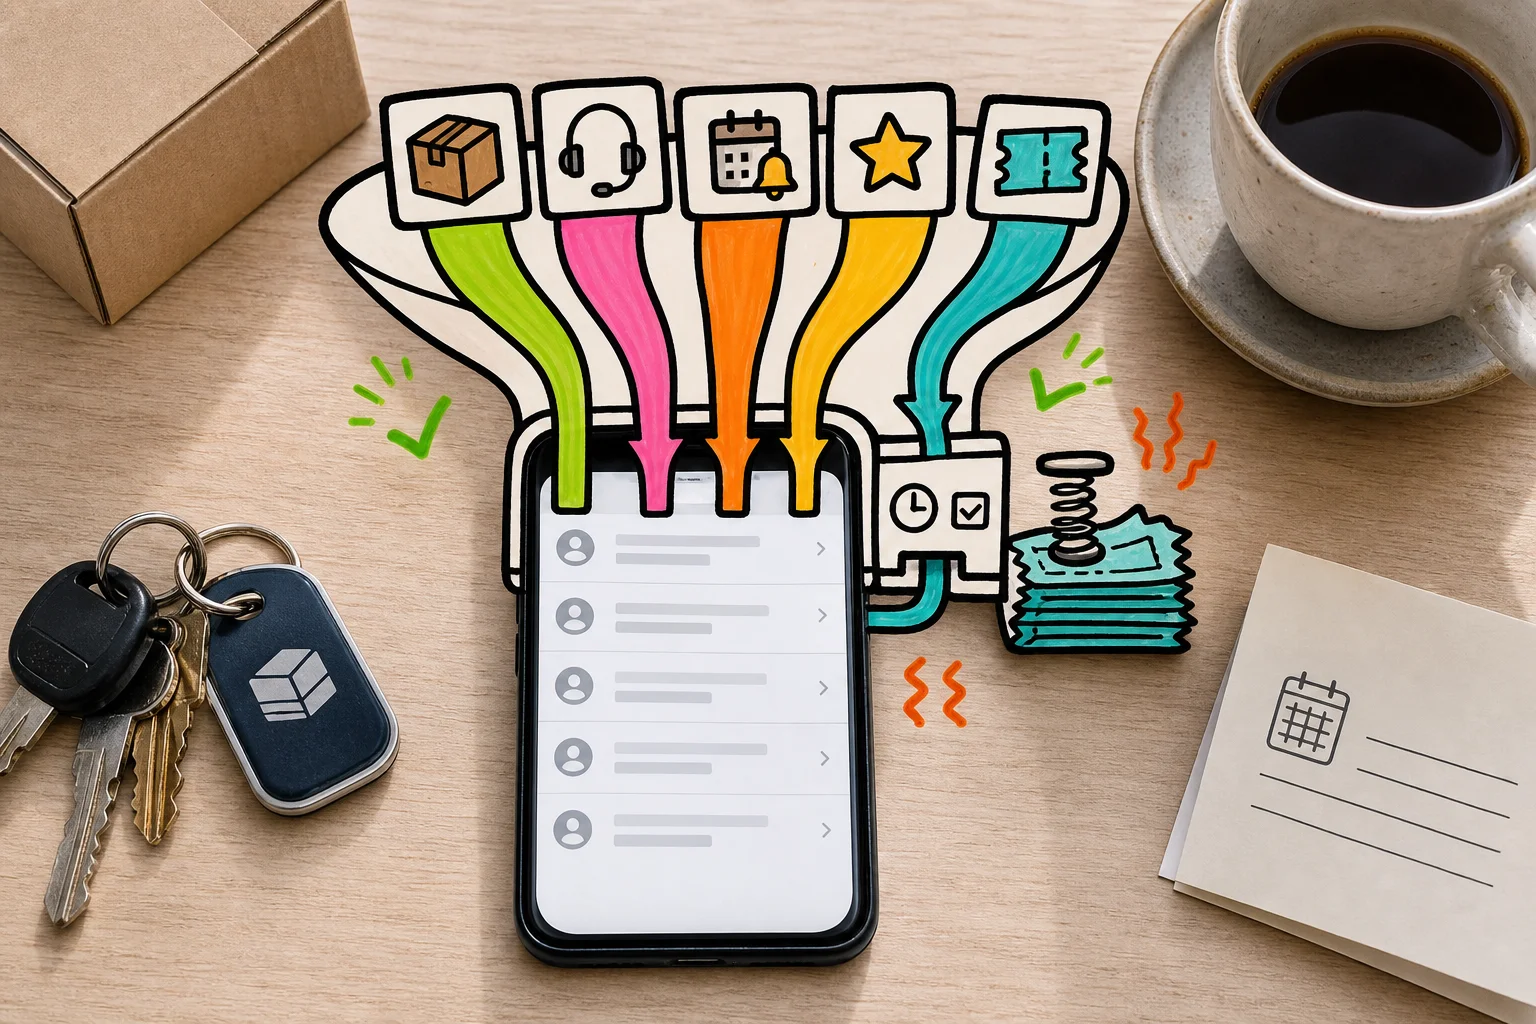
Promotional SMS has a smaller margin for laziness. SimpleTexting’s survey data says 28% of consumers say their biggest question before opting into business texts is how often the business will text them. Its 2025 reporting also flags frequent texting as one of the fastest ways to lose subscribers. That does not mean promotions fail by default. It means SMS promotions need permission, timing, relevance, and restraint.
The channel comparison also matters. Twilio reports that 75% of consumers rank email in their top three preferred channels for branded communications, and that 79% of retail shoppers prefer email. So the better reading of the sms marketing stats is simple: use SMS for urgency, utility, and high-intent moments. Use email when the message needs room to breathe.
Separate attention, clicks, and replies before you benchmark SMS
The famous SMS open rate claim needs a seatbelt. SMS open rates are not measured like email opens. Email opens usually depend on a tracking pixel loading, which is already messy because of privacy features, image blocking, and inbox behavior. SMS does not have the same open-tracking mechanism. A delivered text that appears on a lock screen, notification tray, smartwatch, or message preview is not the same thing as a tracked email open.
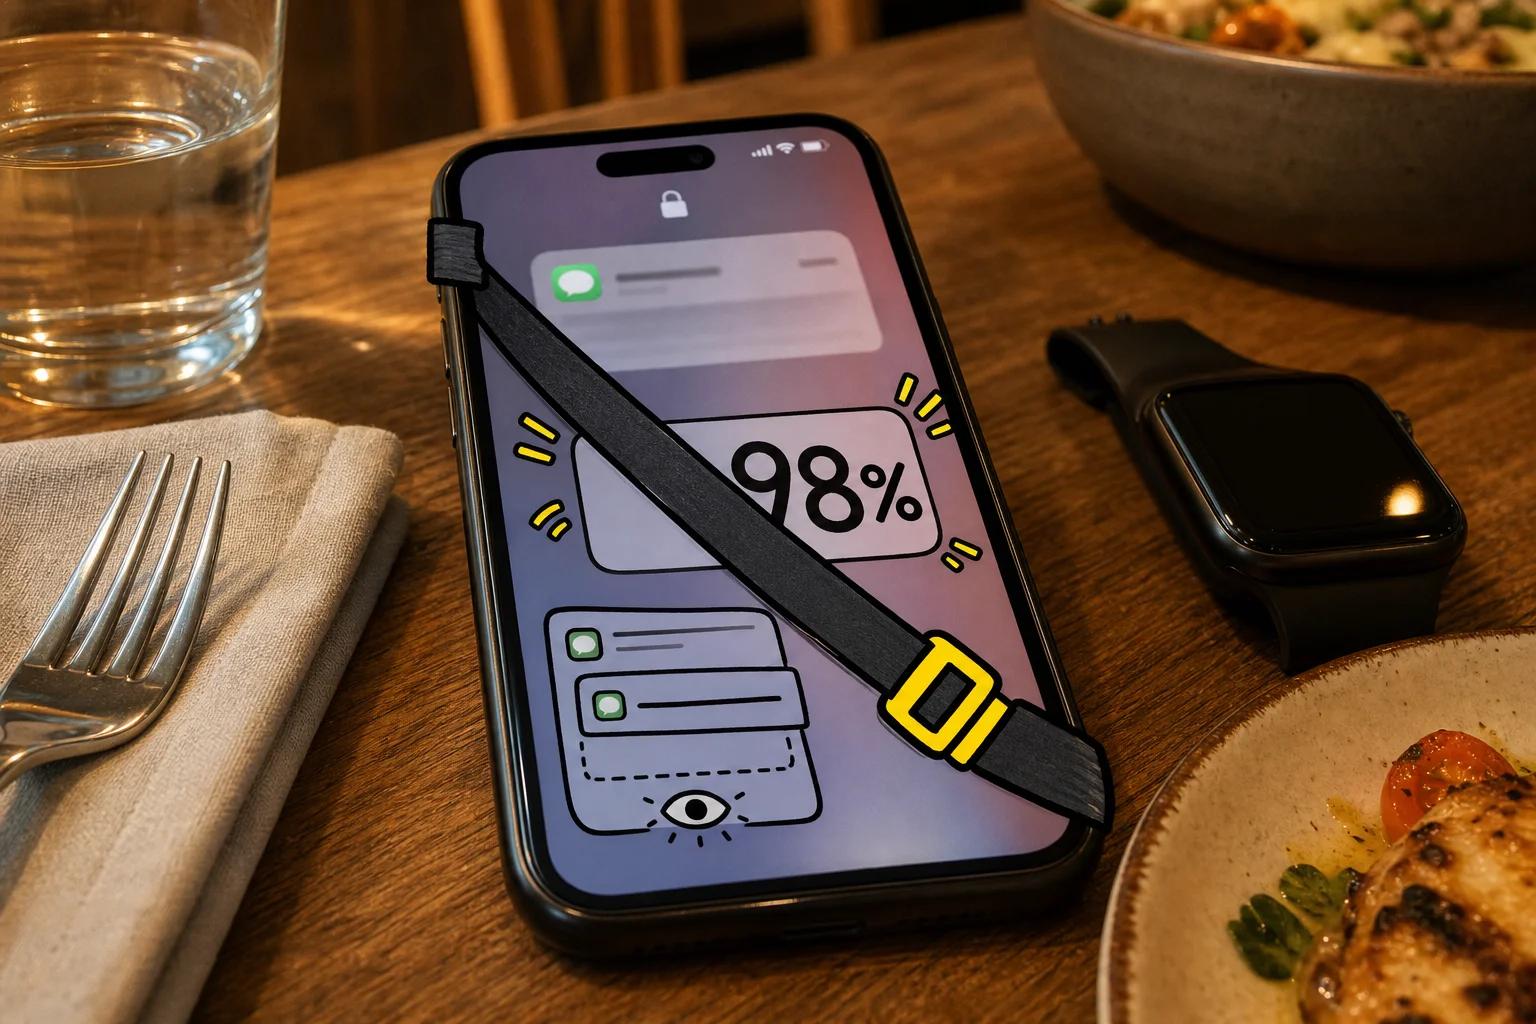
That is why the 98% SMS open rate should be treated as directional, not as a precise universal benchmark. It tells you SMS tends to get high visibility. It does not tell you the recipient read the full message, clicked, replied, bought, or felt good about your brand interrupting dinner.
For benchmarking, the cleaner metric is SMS click-through rate, because it is usually calculated as unique clicks divided by delivered messages. Klaviyo’s public SMS campaign benchmarks put less than 5.9% CTR in the “Critical” band, 6.0% to 8.8% as “Room for improvement,” 8.9% to 14.5% as “Good,” and 14.6% or higher as top-tier performance. A 2026 meta-compilation that pulls together Klaviyo, Postscript, and Attentive benchmark data cites a median SMS CTR of 8.7%, which lines up more closely with the lower end of the “good” range than with the 19% to 35% figures you will see in some vendor roundups.
Triggered messages deserve their own benchmark. Klaviyo reports that flow-based SMS click rates average near 10%, roughly double campaign performance, and one benchmark synthesis places stronger automated-flow CTR around 10.9% to 14.9%. That makes sense. A cart reminder, back-in-stock alert, or replenishment nudge usually has more intent behind it than a broad weekend promo.
Response rate is a different signal. A reply means the message created a conversation, which matters for sales teams, support, appointment scheduling, and local services. For ecommerce promos, a low reply rate may be fine if the message drives clicks. For customer service, a high reply rate may be the whole point.
SMS may drive stronger immediate attention than email in urgent, short-message use cases. Email often wins on richer creative, lower marginal cost, deeper segmentation, and higher campaign volume. If you are comparing SMS against newsletter performance, use comparable metrics where you can, and read the caveats in our newsletter statistics breakdown before declaring a winner.

SMS earns revenue when timing and intent are doing the heavy lifting
SMS conversion rate benchmarks look best in ecommerce when the message is tied to an obvious buying moment: abandoned cart, back-in-stock, replenishment, product launch, price drop, VIP early access, or a short-lived offer for people who already asked to hear from the brand.
Abandoned cart is the cleanest example. Postscript reports a 9.1% average conversion rate for abandoned-cart SMS automations, while Klaviyo’s abandoned-cart email benchmark shows a 3.33% average placed order rate. That does not prove SMS is universally better than email. It suggests that for cart abandoners, a fast, consent-based text can compete very well with email, especially when the purchase intent is still fresh.
A 2026 cross-vendor benchmark synthesis reports abandoned-cart SMS automations at 18.4% median CTR and $3.94 revenue per send. Treat that as directional because attribution methods vary. Postscript’s ecommerce program benchmarks put revenue per message around $0.98 at the median, $2.13 at the 75th percentile, and $4.54 at the 90th percentile, which is more useful for planning than a giant “SMS ROI” claim with no denominator.
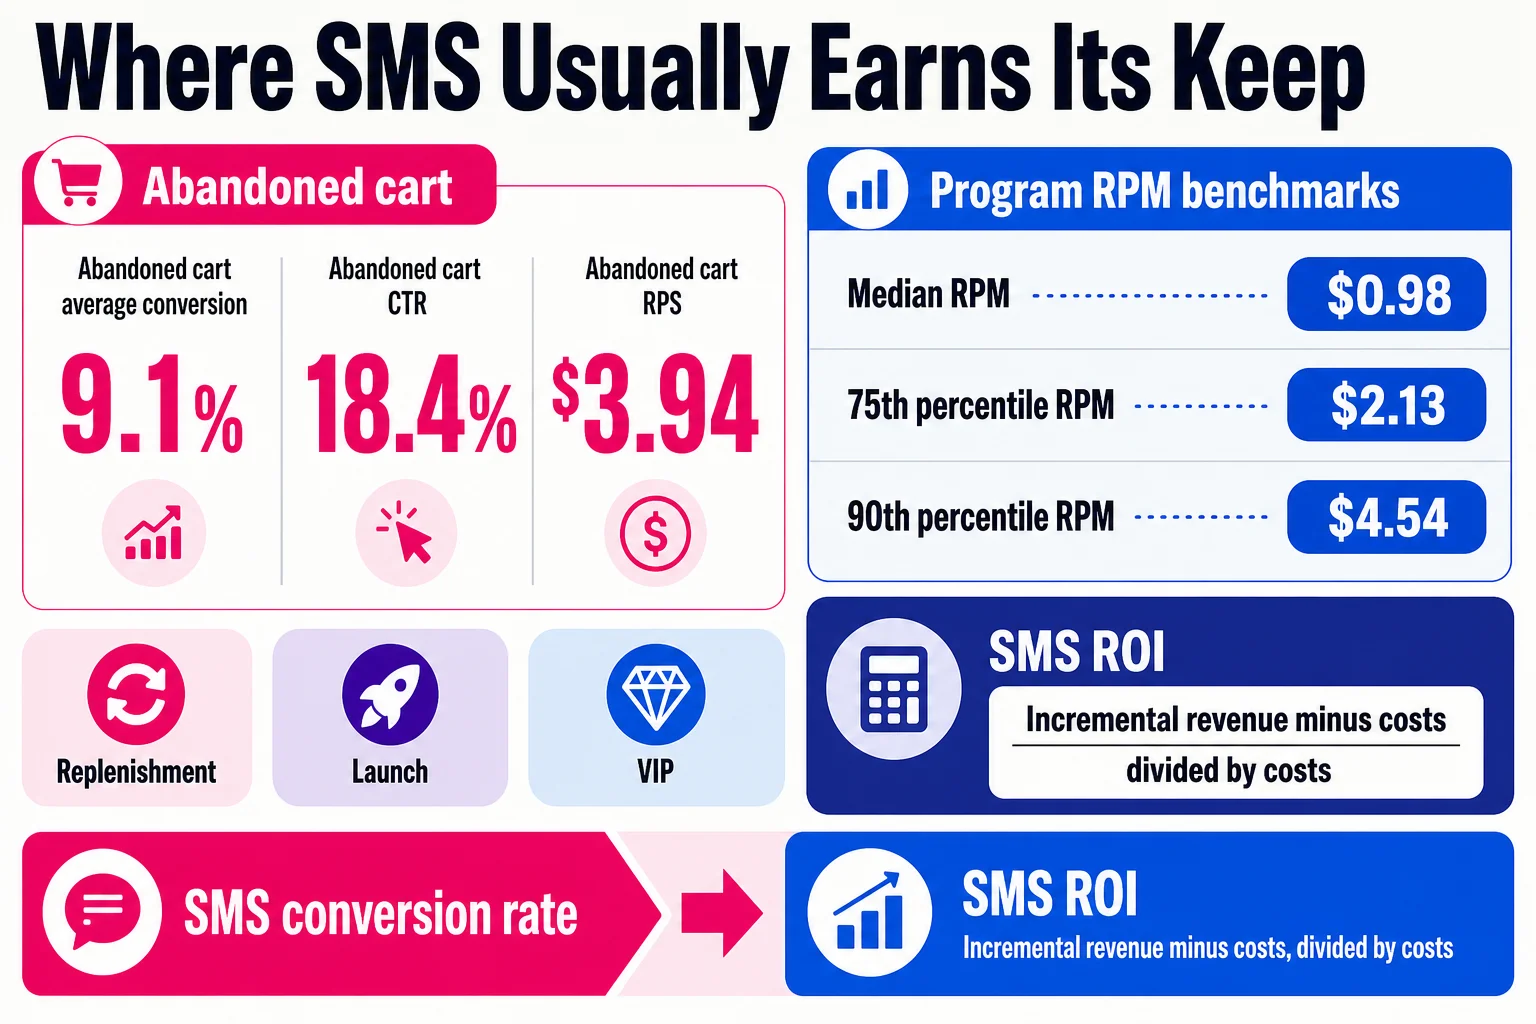
The ROI math should be boring. Use incremental revenue minus message costs, platform costs, carrier fees, and discounts, divided by those costs. Twilio lists U.S. outbound SMS at $0.0083 per segment, but real campaign cost can rise with carrier surcharges, MMS, long messages, Unicode, and 10DLC fees. A 15% discount that “drives revenue” may also train customers to wait.
SMS ROI gets inflated when reports rely on last-click attribution, generous click windows, view-through-style assumptions, cherry-picked VIP segments, or revenue that email, paid search, direct traffic, or brand demand would have captured anyway. The stronger test is incrementality: hold out a comparable group, measure the lift, and compare that lift against the full cost of sending.
Keep the list healthy or the benchmarks stop mattering
SMS list growth only helps when consent, relevance, and deliverability stay intact. The FCC’s January 2024 rulemaking clarified one-to-one consent under TCPA rules for marketing texts, and automated marketing texts count as calls under TCPA rules. This is compliance context, not legal advice. Talk to qualified counsel or your SMS provider before writing consent language, opt-out rules, or reactivation flows.
Healthy programs make the boring parts visible: clear opt-in language, brand identity, expected frequency, STOP and HELP instructions, terms and privacy links, clean suppression rules, and sane message frequency. Consumers may revoke consent in a reasonable manner, and businesses cannot force one exclusive opt-out method, based on law-firm summaries of the FCC rule.
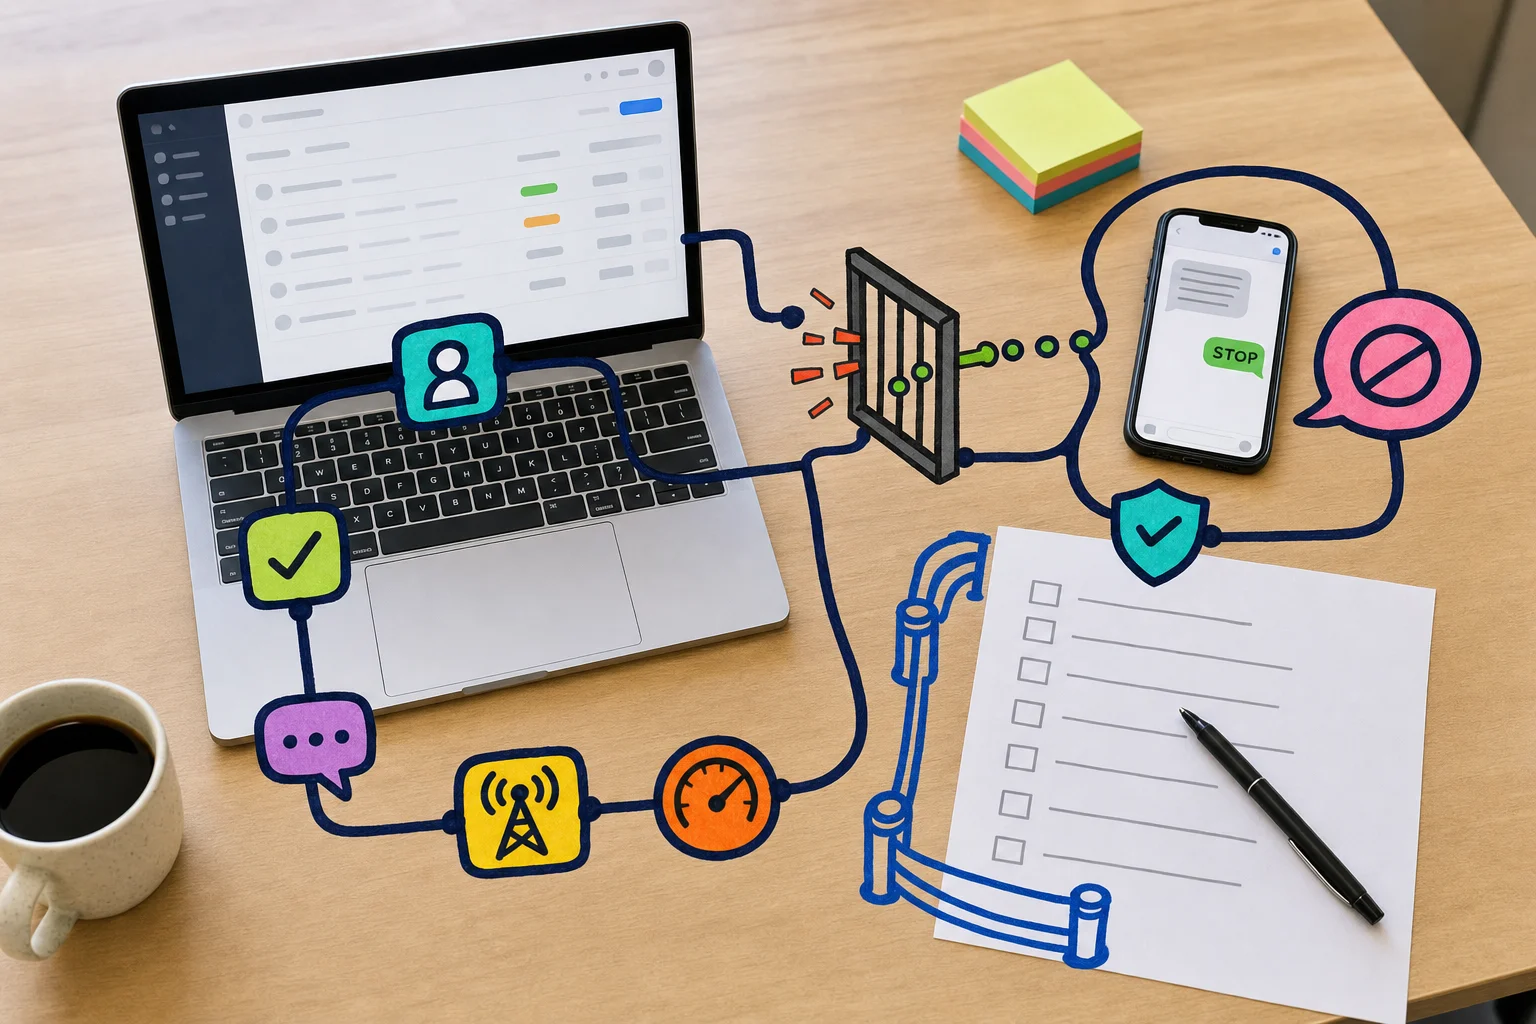
Deliverability belongs in the performance report. U.S. business texting often depends on A2P 10DLC registration, declared use cases, clean URLs, and standard opt-out handling. Twilio notes that 10DLC registration helps reduce carrier filtering risk, and promos that do not match the registered use case can get filtered or blocked.
Use benchmarks by message type. Separate campaigns from flows. Compare SMS against email with holdouts and incremental lift, not last-click victory laps. Track opt-outs per send, delivery errors, carrier filtering, CTR, SMS conversion rate, and revenue per recipient together.
What are the most important SMS marketing statistics? CTR, conversion rate, opt-out rate, revenue per recipient, delivery rate, and incremental lift beat recycled open-rate claims.
What is a good SMS click-through rate? Promotional campaigns often land in the low single digits to low teens. Triggered flows can be higher.
What is a realistic SMS open rate? SMS opens are not measured like email opens, so treat the famous 98% claim as directional.
Is SMS marketing effective? Yes, when the list is consent-based, the timing is strong, and the message is useful. Compare it with email using incremental lift.