The review numbers that affect trust and conversion in 2026
Online reviews sit very close to the money. A star rating on Google, Yelp, Amazon, Tripadvisor, G2, Trustpilot, or a product page can decide whether someone clicks, calls, books, adds to cart, or quietly disappears like they were never there.
The 2026 online review statistics point in the same direction: reviews are now part of the buying path. BrightLocal’s 2026 Local Consumer Review Survey reports that 97% of consumers read reviews for local businesses. Capital One Shopping’s 2026 online reviews statistics report says more than 99% of American consumers read online reviews before making purchases, and it also cites the familiar conversion reality hiding inside all those little yellow stars: conversion rates peak at a 4.75 to 4.9 out of 5 rating.
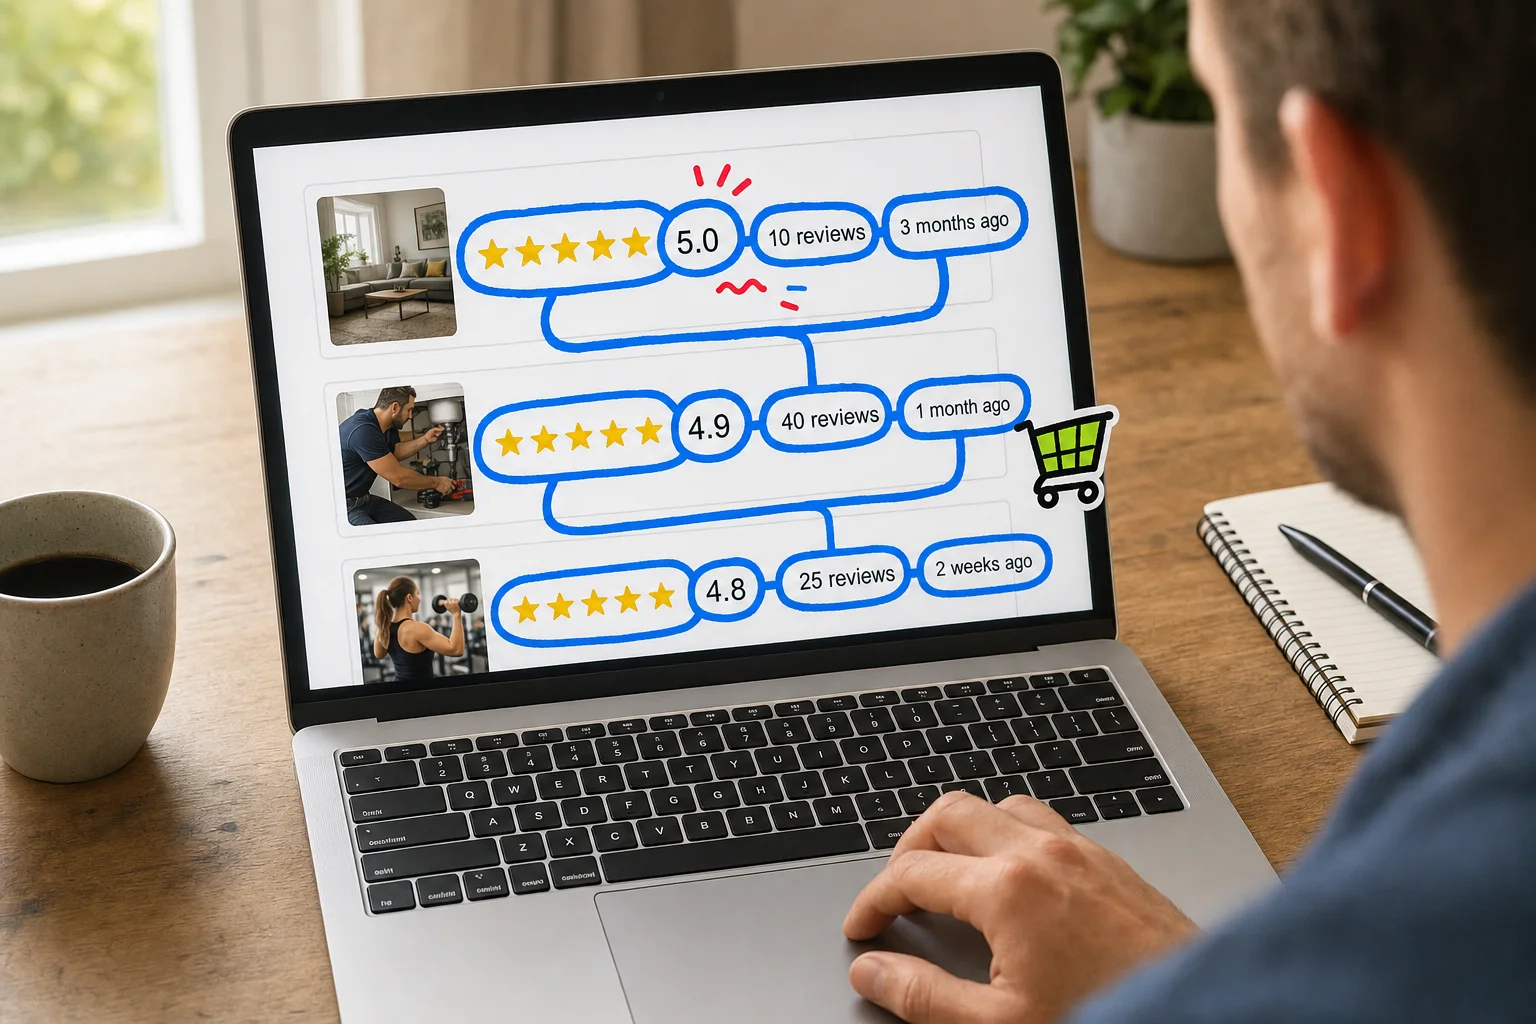
That does not mean every business should chase a perfect 5.0. Perfect ratings can look thin, new, filtered, or suspicious, especially when the review count is low. Some secondary 2026 summaries report that consumers may trust ratings around 4.2 to 4.5 more than a flawless 5.0, but that claim needs careful handling because trust varies by category, platform, price point, and risk. A pizza place, a roofer, a hotel, and a B2B SaaS vendor do not get judged the same way. Nobody shops for emergency plumbing with the same emotional settings they use for novelty socks.
Review recency matters too. Capital One Shopping reports that 32% of consumers only read reviews written within the previous two weeks, 44% expect reviews within one month, and 77% expect reviews within three months. For operators, that makes review generation a weekly system, not a once-a-quarter panic project.
Fake-review concern is the other big trust tax. The same research reports that 75% of shoppers who read reviews are concerned about fakes, and 54% will not purchase if they find fake or fraudulent reviews. That makes review quality, response behavior, and platform-specific monitoring part of conversion rate optimization, not just reputation management.
For related operating guides, connect this page to your internal hubs on local SEO, conversion rate optimization, reputation management, and ecommerce SEO.
Online review statistics: the short version
The useful review stats for 2026 are the ones that change how you run the business: how often people read reviews, where the star-rating floor sits, how fresh reviews need to be, whether volume creates trust, whether responses matter, and how fake-review concern affects the sale.
Quick caveat: Google, Yelp, Amazon, Tripadvisor, G2, Trustpilot, and first-party product reviews do different jobs. A 4.4 rating on a busy restaurant profile does not mean the same thing as a 4.4 rating on a $2,000 B2B software listing. Use these as benchmarks, then compare against your category, platform, location, and price point.
| Behavior or threshold | 2026 statistic | What to monitor |
|---|---|---|
| Local review reading | BrightLocal’s 2026 Local Consumer Review Survey says 97% of consumers read reviews for local businesses. | Track visibility on Google Business Profile, Yelp, Tripadvisor, and relevant industry directories. |
| Purchase review reading | Capital One Shopping reports that more than 99% of American consumers read online reviews before making purchases. | Add review content to product pages, landing pages, and comparison pages where buyers decide. |
| Star-rating floor | BrightLocal’s 2026 Local Consumer Review Survey says 68% of consumers require at least 4 stars, and 31% will only use businesses rated 4.5 stars or higher. | Watch rating by location, product, service line, and platform. A blended average can hide the weak branch. |
| Review volume | BrightLocal’s 2026 Local Consumer Review Survey says 47% of consumers will not use a business with fewer than 20 reviews. | Set minimum review-count goals for each important profile or product, not just the company total. |
| Review recency | BrightLocal’s 2026 Local Consumer Review Survey says 74% of consumers only care about reviews written within the last 3 months. | Measure new reviews per week or month. A great 2023 review is basically a framed diploma in the lobby. Nice, but not doing much selling. |
| Conversion impact | Capital One Shopping reports that consumers are 270% more likely to purchase a product with five reviews than one with zero reviews. | Test review placement near calls to action, pricing, specs, booking forms, and cart steps. |
| Fake-review concern | Capital One Shopping reports that 67% of consumers are concerned about review fraud, and 85% suspect reviews are fake sometimes or often. | Audit suspicious spikes, repeated phrasing, reviewer patterns, and AI-ish praise that sounds generic or suspicious. |
| Platform responsibility | BrightLocal’s 2026 Local Consumer Review Survey says 63% of consumers believe review platforms are responsible for detecting fake reviews. | Report fake reviews through each platform’s process, but keep your own documentation. Enforcement varies. |
Owner responses belong in the short version, even when the benchmark number is harder to pin down cleanly. Buyers read the review, then often read the business response to see whether the company sounds helpful, defensive, absent, or like a copied legal disclaimer. Track response rate, response time, tone, and whether complaints get a useful next step.
Connect these benchmarks to your local SEO, conversion rate optimization, reputation management, and ecommerce SEO reporting. Reviews can affect visibility, but they also affect the human decision after the click.
Reviews now sit inside the buying path
Review reading is close to universal because buyers use reviews before they commit, not after they already trust you. For local businesses, BrightLocal’s 2026 Local Consumer Review Survey says 97% of consumers read reviews for local businesses, and 41% always read reviews before choosing a business, up from 29% the year before. That is a big jump in habitual review checking.
For broader purchase behavior, Capital One Shopping reports that more than 99% of American consumers read online reviews before making purchases, and that reviews influence 93% of purchasing decisions. The exact journey changes by category, but the pattern is hard to miss: reviews are part of the conversion path.
A local buyer might search “emergency plumber near me,” scan Google reviews, compare two profiles, then call the business that looks least risky. An ecommerce buyer might read product reviews on a category page, open the one-star reviews first to look for deal-breakers, check photos, then decide whether the product deserves a spot in the cart. A software buyer may read G2, Capterra, Reddit, vendor case studies, and first-party testimonials before booking a demo.
The operational point is simple: do not measure reviews only as a brand or local SEO asset. Track where buyers encounter them before a call, form fill, booking, demo request, add-to-cart, or checkout. Your online review statistics should connect review visibility to the places where people make decisions, including local SEO, ecommerce SEO, and conversion rate optimization reporting.
The review score needs backup from volume and recency
A 4.8-star rating looks great until the buyer sees it comes from six reviews, three of them written during the Obama administration. That is when the mental math starts. Is the business still good? Did the owner ask cousins for reviews? Did the best employee leave in 2021? Buyers do this little courtroom drama fast, often before they ever click your site.
BrightLocal’s 2026 Local Consumer Review Survey data points to three trust filters buyers use together: rating, review count, and review recency. The online review statistics are useful because they give teams actual thresholds to monitor instead of staring at an average star rating and hoping it explains demand.
| Trust signal | 2026 benchmark | What to monitor |
|---|---|---|
| Star rating | 68% of consumers require at least 4 stars | Average rating by location, category, and platform |
| Higher rating bar | 31% will only use a business rated 4.5 stars or higher | Profiles below 4.5 in high-intent search results |
| Review volume | 47% won’t use a business with fewer than 20 reviews | Locations, products, or service pages under 20 reviews |
| Review recency | 74% only care about reviews from the last three months | Fresh review flow by week and month |
| Very recent proof | 32% look for reviews from the last two weeks, and 18% only pay attention to the last week | Review velocity after jobs, purchases, visits, and support interactions |
The useful read is not “get a perfect score.” Perfect scores can look thin or suspicious in some categories, especially when there are only a handful of reviews. A 4.6 with 240 recent, specific reviews may feel safer than a 5.0 with 11 vague reviews. The exact effect depends on the platform and category. Google local reviews, Amazon product reviews, G2 software reviews, and marketplace seller reviews do not carry trust in the same way.
Review recency deserves special attention because it is the easiest trust signal to neglect. A business can earn a strong rating, stop asking for reviews, and slowly turn its profile into a museum exhibit. Buyers want evidence that the current team, current product, current delivery process, and current support experience are still good.
For operations, track rating, volume, and recency together in one dashboard. Flag any location, product, or profile that drops below 4.0, sits under 20 reviews, or has no meaningful reviews in the last 30 to 90 days. That turns online reviews statistics into a weekly conversion checklist instead of a quarterly reputation panic.
Put review proof where buyers hesitate
Reviews work hardest when they sit near the decision, not buried in a footer or isolated testimonial block. On product pages, displaying user-generated content has been tied to a 28% conversion lift, and landing page roundups report that customer testimonials can increase conversions by around 34%. Treat those numbers as directional, because test quality varies by industry, traffic source, device, and offer.
The practical setup is simple. Put a compact proof point near the first CTA, such as “4.8 stars based on 1,247 reviews.” Add three to six specific testimonials near forms, pricing blocks, booking buttons, and checkout. Use a mid-page proof section for longer reviews, photos, platform logos, and a mini case study.
Example: a multi-location dental group had strong Google ratings, but its appointment page showed none of them. Adding a short patient quote, location rating summary, and “responds within one business day” note beside the booking form reduced perceived risk and lifted booked consultations in the next test cycle.
Owner responses matter here, too. BrightLocal’s review research shows consumers pay attention to how businesses handle feedback, and Google’s guidance recommends replies that are timely, professional, concise, and privacy-safe. For more placement ideas, see our guides to landing page statistics and conversion rate optimization statistics.
FAQ
How many people read reviews before buying? BrightLocal’s 2026 data says 97% of consumers read online reviews; Capital One Shopping says more than 99% of American consumers read reviews before purchases. Either way, review-reading is now a normal buying behavior.
What star rating do buyers expect? BrightLocal reports 31% require 4.5+ stars, and 68% require at least 4 stars. Capital One Shopping puts peak conversion around 4.75 to 4.9 stars.
How fresh do reviews need to be? BrightLocal says 74% care about reviews from the last 3 months; Capital One Shopping says 32% only read reviews from the previous two weeks.
Do owner responses matter? Yes. BrightLocal says 56% prefer businesses that respond.