
What is a good landing page conversion benchmark?
Landing page conversion benchmark data is useful when it compares your page to a similar page, with a similar offer, from a similar traffic source. A generic average can be real and still be easy to misuse.
The broadest credible baseline is Unbounce’s Q4 2024 dataset, which reports a 6.6% median conversion rate across industries from more than 57 million conversions, 41,000 landing pages, and 464 million pageviews. That number often gets repeated as an “average,” but Unbounce uses medians and cohort comparisons, which is the right instinct. A small number of outlier pages can distort a mean, especially when the dataset blends webinars, paid social tests, branded search pages, and many different offer types.
For planning, treat 2% to 5% as a conservative generic range when you do not yet know the page type, channel, or offer. That range is synthesized from third-party summaries like ZoomInfo’s landing page benchmark discussion and broader landing page statistics covered in our own landing page statistics and marketing benchmarks resources. Treat 6.6% as a broad median reference point, not a universal target. Treat 10% or higher as a strong signal only after the cohort makes sense.
A 12% conversion rate can be excellent for a cold B2B demo request page where the visitor is being asked to talk to sales, share business details, and accept that a rep may soon appear in their inbox. The same 12% can be normal, or weak, for a warm email audience downloading a checklist, registering for a low-commitment webinar, or completing a quiz with almost no friction.
ClickMinded is compiling and interpreting third-party benchmark data here. We are not claiming to own proprietary landing page conversion benchmark data. Compare by offer type, channel, funnel stage, industry, audience intent, and conversion definition. For the metric side, keep marketing metrics nearby.
Landing page conversion benchmark table: useful ranges, sources, and caveats
Use this as a planning reference, then sanity-check the cohort before calling a page good or bad. Keep marketing benchmarks nearby for broader comparisons, and use marketing metrics before anyone compares different conversion events under the same label.
| Metric or page type | Useful range or baseline | Source context | Caveat |
|---|---|---|---|
| Overall landing page conversion rate | 6.6% median | Q4 2024 Unbounce cohort, about 41,000 landing pages, 464 million visits, 57 million conversions | Broad dedicated landing page baseline. A median is not a target. |
| High performer or top quartile | 11.4% as the 75th percentile starting point | Unbounce landing page benchmark guidance | Still needs industry, channel, and offer context. |
| B2B demo or request page | Planning range synthesized from cited sources | Based on the Unbounce median and higher-friction B2B conversion context | A demo request is a sales hand-raise. Compare it with similar B2B pages, not ebook downloads. |
| Lead magnet or webinar page | Planning range synthesized from cited sources | Based on landing page benchmarks and lower-friction lead capture patterns | Topic, audience warmth, and gating can swing results hard. |
| Ecommerce product or offer page | 1.9% to 2% global ecommerce range, 2.5% to 3% for Shopify stores | Ecommerce store benchmarks | Checkout intent, price, device, traffic source, and category matter more than the sitewide average. |
| Paid search landing page | 8.18% average Google Ads search CVR | LocaliQ 2026 Google Ads search benchmark | Ad-platform CVR is not identical to landing-page CVR. Definitions vary. |
| Paid social landing page | Planning range synthesized from cited sources | Based on cold-audience channel behavior and landing page context | Benchmark retargeting separately from prospecting. Intent is different. |
| Email traffic landing page | 19.3% average landing page conversion rate from email | Unbounce channel benchmark data | Email lists are warmer. List quality and segmentation can make this look stronger or weaker than the broad benchmark. |
| Form completion rate | 1.7% average view-to-submission rate and 45% visitor-to-completion figure | Form sources using different denominators | ”Viewed form,” “started form,” and “submitted form” are different metrics. Do not mix them. |
| Lead quality or MQL rate | Planning range synthesized from cited sources | Depends on CRM rules, sales acceptance, and scoring model | A higher page conversion rate can lower lead quality if the offer attracts the wrong people. |
| Follow-up conversion to meeting or opportunity | 66.7% of qualified demo form submissions book a meeting | Chili Piper 2025 demo form benchmark across 4 million submissions | This is post-form performance, not landing page CVR. Speed-to-lead and routing rules matter. |
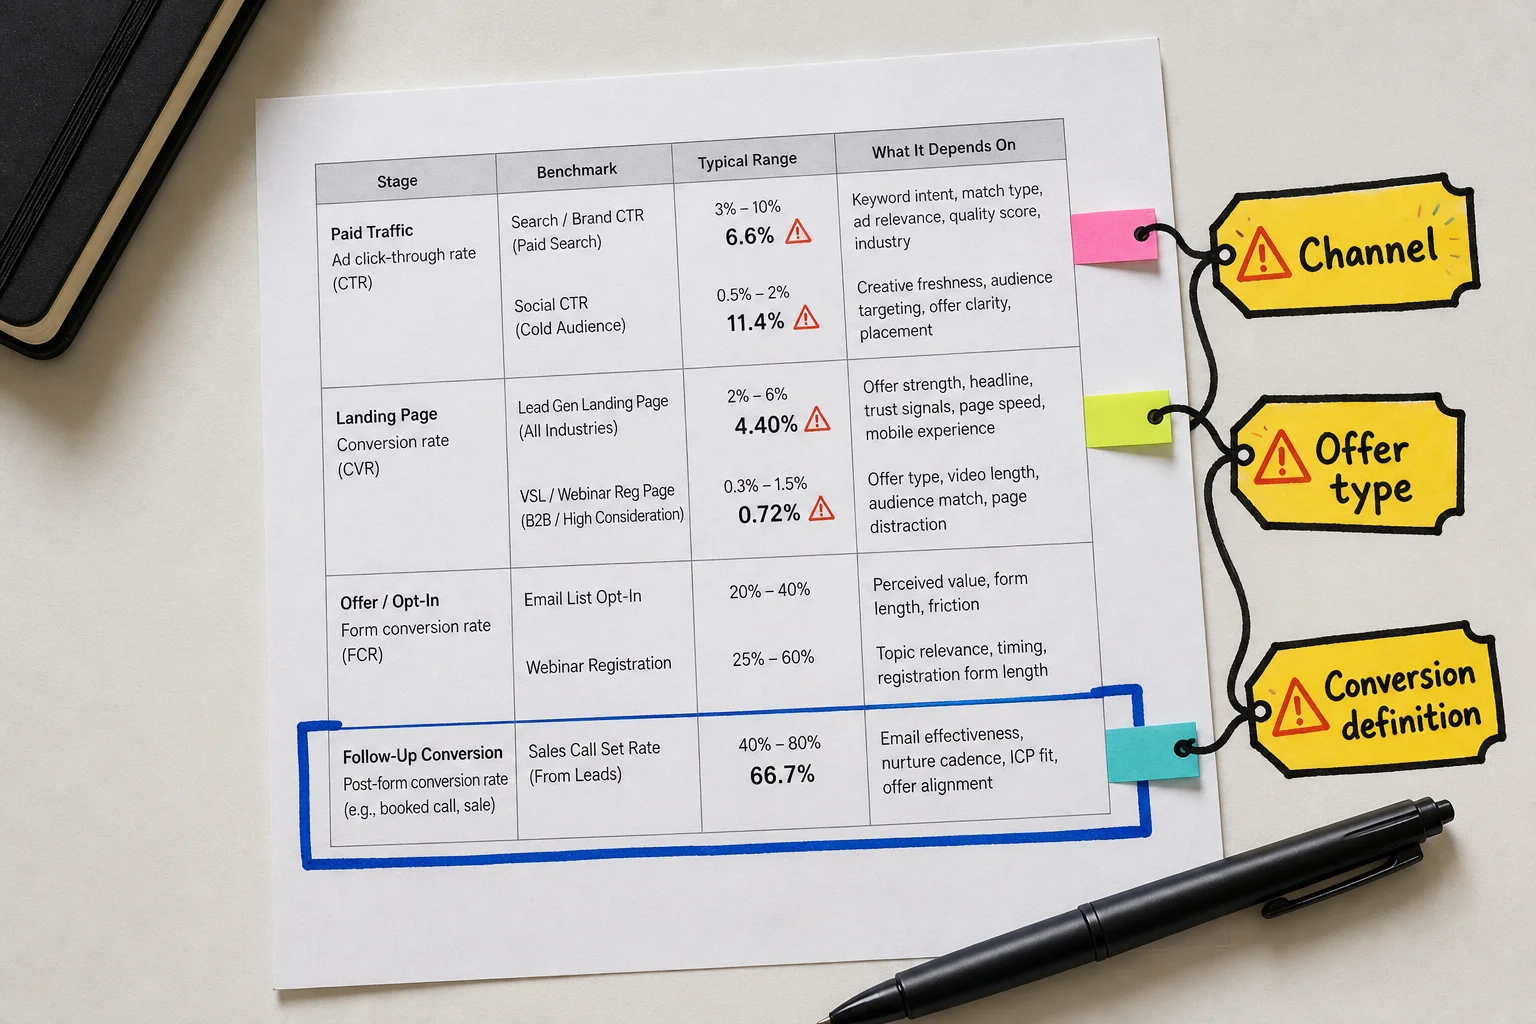
The table works because it keeps unlike things in separate boxes. Compare an ecommerce checkout rate to a B2B demo request rate and the benchmark is no longer comparable.
Check the method before you trust the average
A single average is usually the least interesting number in the room.
Average can mean the arithmetic mean, where you add every page’s conversion rate and divide by the number of pages. Median means the middle value, where half the pages convert higher and half convert lower. The mean gets pulled around by extreme performers. The median is harder to distort, which is why it is often more useful for broad benchmark datasets.
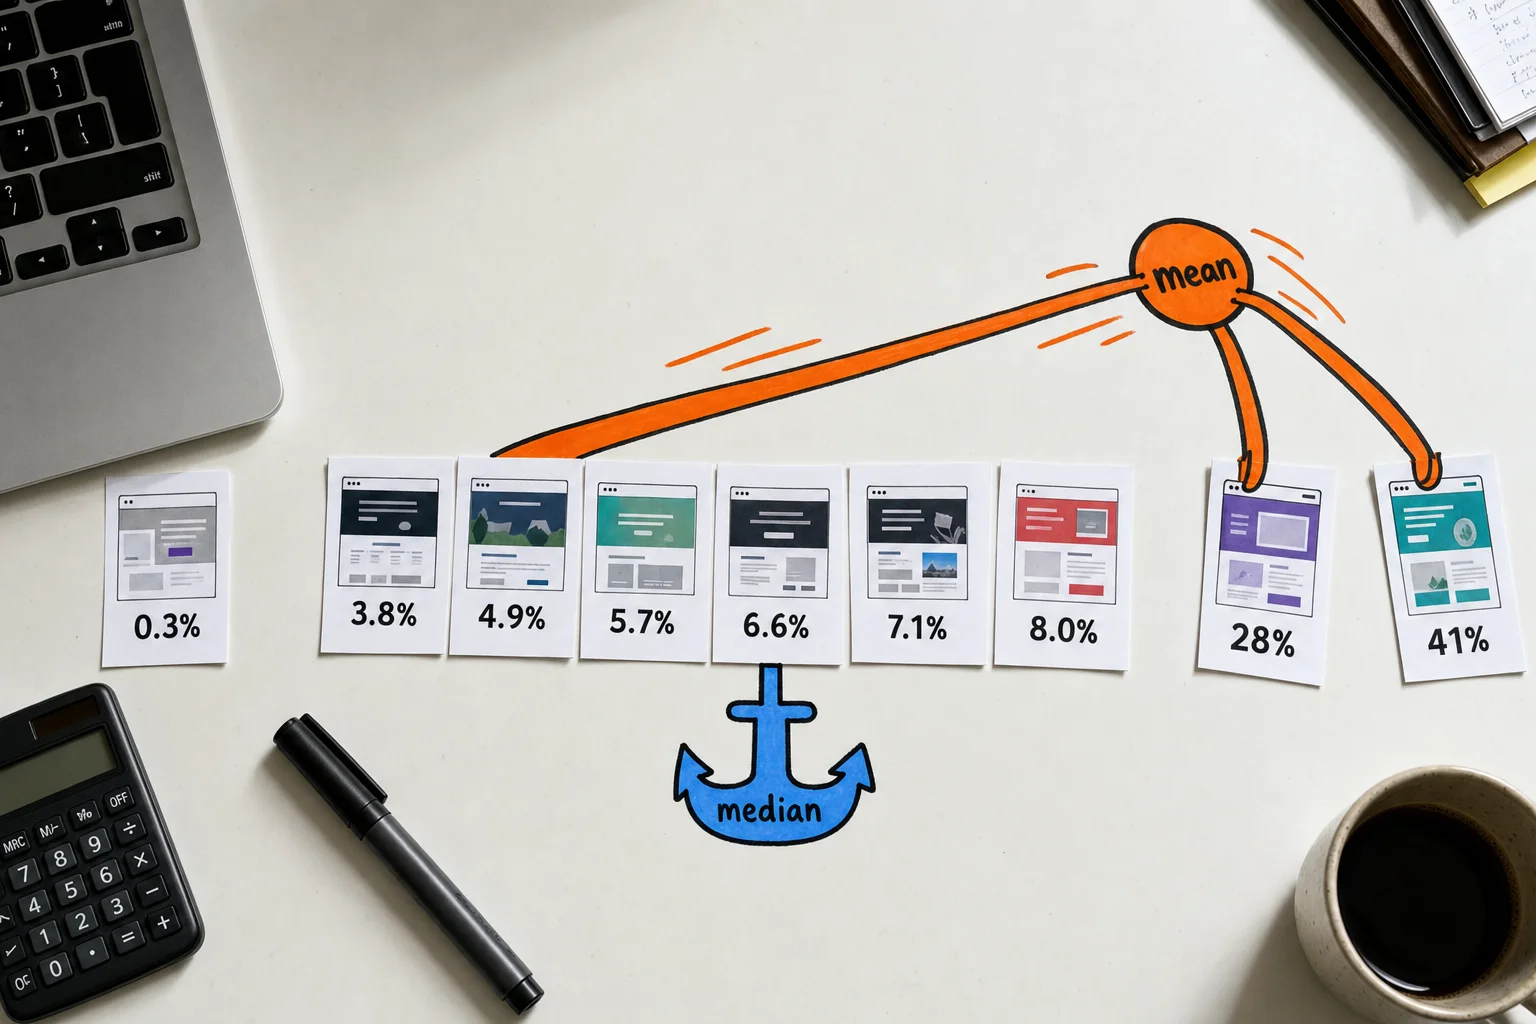
This is where the widely quoted Unbounce number needs careful reading. Unbounce’s reader-facing copy often describes 6.6% as the average landing page conversion rate, based on Q4 2024 data from about 41,000 landing pages, 464 million pageviews, and 57 million conversions. Its benchmark methodology and benchmark pages clarify that the 6.6% figure is a median, and Unbounce’s own benchmark guidance pushes readers toward industry cohorts, conversion goals, channels, and percentile comparisons rather than one universal target.
That is not Unbounce being wrong. It is a common benchmark-reporting problem: the easy number gets quoted, while the method that makes the number useful gets skipped.
Before you trust any landing page conversion benchmark, check four things: whether the number is mean or median, what counted as a conversion, which pages were included, and whether the cohort matches your channel, industry, funnel stage, and offer. If a source cannot answer those questions, treat the number as a loose planning reference, not a performance grade. For broader source-checking habits, keep marketing statistics nearby when comparing benchmark claims across marketing datasets.
Compare landing page benchmarks by what the visitor has to do
A landing page conversion benchmark only makes sense after you define the ask. A PDF download, a webinar signup, a demo request, and a completed order can all show up as “conversions” in analytics. They do not carry the same intent, risk, or sales value.
Demo and contact sales pages ask for time, budget fit, and usually a sales conversation, so the expected conversion rate is lower. For SaaS demo request pages, one 2026 benchmark table reports a 3.8% median conversion rate, 6.1% for the top 25%, and 9.3% for the top 10%. Other B2B SaaS planning ranges commonly put demo or contact forms around 2% to 5%, with cold paid traffic often closer to the low end.
That makes a 12% demo page very strong in many B2B SaaS contexts. The same 12% on a warm email landing page for an existing customer upsell may be less remarkable. Same number, different room.
Lead magnets usually convert higher because the visitor is trading an email address for a checklist, template, guide, or short report. Some opt-in-focused datasets report much higher rates than broad landing page datasets, including an approximately 23% average for sign-up optimized landing pages. Treat that as an opt-in benchmark, not a demo benchmark.
Webinars sit between a content download and a sales call. Registration pages can convert well when the audience knows the brand or the topic feels urgent, but the follow-up matters more than the signup: attendance rate, show rate, meeting booked rate, MQL rate, SQL rate, and opportunity creation.
Ecommerce benchmarks usually measure session-to-order conversion, not “clicked the CTA.” Shopify defines ecommerce conversion rate as orders divided by website sessions, and most ecommerce benchmark reports are storewide rather than product-page-only. Product price, discount depth, inventory, shipping terms, device mix, and checkout friction all change the target. A $19 impulse product and a $1,200 mattress should not share the same goal.
Form completion is useful, but it is not the finish line for lead generation. A page that converts 8% of visitors into free PDF downloads may create cheap contacts that never become sales conversations. Another page that converts 8% into demo requests may produce fewer names but more qualified opportunities.
Track the chain after the form: lead quality, MQL rate, SQL rate, meeting booked rate, show rate, opportunity creation, and closed revenue. For more on downstream lead quality benchmarks, see lead generation statistics. For clean metric definitions, keep marketing metrics close while you build the report.
Benchmarks by traffic source: paid search, paid social, email, organic, and referral
Paid search often starts with stronger intent because the visitor is actively looking for a product, service, or answer. Search benchmarks usually sit above cold social benchmarks, especially for branded queries, urgent local services, and bottom-of-funnel offers.
LocaliQ reports an 8.18% average conversion rate for Google Ads search campaigns across industries in 2026, while WordStream’s 2025 report puts the overall search conversion rate at 7.52%. Useful anchors, yes. Universal landing page benchmarks, no. Branded search, competitor search, nonbrand category search, and broad informational search need separate targets. For more PPC context, see google ads benchmarks.
Paid social is usually colder because the ad interrupts a feed instead of answering an active search. Retargeting is the exception, especially recent cart abandoners, pricing-page visitors, or people who watched a demo. Meta benchmarks also depend on what Ads Manager counts as the conversion. A lead form, landing page form fill, purchase event, and custom pixel event are not the same thing. LocaliQ reports a 7.72% average conversion rate for Meta leads objective campaigns, with Restaurants and Food at 18.25%, Attorneys and Legal Services at 10.53%, and Education and Instruction at 10.08%. Treat those as Meta lead-campaign benchmarks, not ecommerce purchase benchmarks.

Email and lifecycle traffic can support higher landing page expectations when the list is engaged and the offer follows from the email. A customer upsell email, abandoned-cart flow, or webinar follow-up is not the same as a cold prospecting click. Mailchimp reports an average email click rate of 2.62% across all users, but that happens before the landing page. One 2026 ecommerce summary reports a 0.16% campaign placed order rate and 2.11% automated flow placed order rate. Measure the post-click landing page separately.
Organic and referral traffic can be warm or cold. A “best CRM for agencies” article may convert far better than a glossary post. A trusted partner referral can beat generic organic, while a broad media mention may send curious visitors who had zero buying intent. Compare intent before you compare rates.
Choose a benchmark cohort that looks like your business
The right landing page conversion benchmark is the closest available peer group, then adjusted for the parts the benchmark cannot see. Industry is a start, but it is not enough.
Use this checklist before you compare:
- Same industry
- Same page type
- Same traffic source
- Same funnel stage
- Same conversion definition
- Same audience temperature
- Similar deal size or AOV
- Similar geography and device mix
- Similar measurement setup
Cohort fit can make a benchmark useful or dangerous. Unbounce compares pages against industry-specific medians using historical customer data and AI-based vertical matching, which is more useful than one blended average. Even then, the cohort may skew toward performance marketers using Unbounce, not every landing page on the internet.
Industry gaps are real. Unbounce reports a 6.6% median landing page conversion rate across all industries, while its finance benchmark shows paid search traffic in financial services at a 10.1% median. Ecommerce benchmarks also move by region, device, and category, as Dynamic Yield’s conversion benchmark data shows.
A SaaS enterprise demo page with a six-month sales cycle, a DTC discount landing page for a $49 product, and a webinar registration page can all report “landing page conversion rate.” Their good rates should be judged against different cohorts. For broader comparison sets, use marketing benchmarks as a starting point, then narrow fast.
Define the conversion before you judge the conversion rate
Use one clean formula before you compare your page to any landing page conversion benchmark:
landing page conversion rate = conversions / landing page visitors or sessions
The denominator changes the answer. Visitor-based rates ask how many people converted. Session-based rates ask how many visits converted. Click-based rates use ad or email clicks. Impression-based rates are view-to-conversion rates, useful for ads but not comparable to landing page session rates.
GA4 can make this messy. GA4 uses “key events” in reports, and session key event rate is sessions with at least one key event divided by total sessions. User key event rate uses users instead. Pick one and label it in your dashboard. More on metric hygiene lives in marketing metrics.
Form metrics need the same discipline. “Form completion rate” can mean submissions divided by landing page sessions, form views, or form starts. Three different numbers.
Separate page conversion from lead quality. Track qualified lead, meeting booked, meeting attended, opportunity, and customer. A high page conversion rate can hurt if it floods sales with bad-fit leads, spam signups, duplicate conversions, or bot traffic. Use conversion rate optimization statistics with CRM data.
Set targets with the right comparison set
Use benchmarks as a planning range, then test them against your own data.
Define the conversion, page type, channel, intent, industry, and funnel stage. Compare medians and quartiles, not just averages. Then add what benchmarks miss: lead quality, sales follow-up, CAC, and pipeline.
Use marketing benchmarks, landing page statistics, and google ads benchmarks to set the range. Test against your baseline with enough sample size, and treat small-sample lifts as directional until they have enough conversion volume to trust.
| Situation | Diagnosis |
|---|---|
| Low conversion, high lead quality | Reduce friction carefully. |
| High conversion, low quality | Tighten offer and targeting. |
| Paid search below benchmark | Check query intent and message match. |
| Email below warm-audience range | Check list fit, offer fatigue, and tracking. |