
Use Google Ads benchmarks as sanity checks before targets
Google Ads benchmarks are useful when they tell you, “This account looks outside the normal range for a similar cohort.” They get dangerous when they turn into universal targets. A 7% CTR might be strong for one non-branded Search campaign, weak for a branded campaign, irrelevant for Display, and the wrong thing to optimize if the leads are junk.
ClickMinded is compiling and interpreting third-party benchmark data here. We do not own the underlying datasets. For broader context across channels, use our marketing benchmarks hub as the comparison layer, then come back to the Google Ads-specific cuts. If you need source-aware Google Ads statistics rather than benchmark ranges, use Google Ads statistics.
A good Google Ads benchmark answers five questions before it gives you a number:
- Which campaign type are we comparing? Search, Shopping, Performance Max, Display, and YouTube do not behave the same way.
- Which industry or product category is this? Legal, apparel, finance, home services, SaaS, and ecommerce have different auctions and conversion paths.
- What is the intent? Branded Search usually has higher CTR and conversion rate than non-branded prospecting because the user already knows you.
- Whose data is this? The 2026 WordStream report covers 13,474 search advertising campaigns across 23 industries from April 2025 through March 2026, and it includes both Google Ads and Microsoft Ads. That is useful, but it is still a specific sample.
- How is the metric defined? CTR, conversion rate, CPA, CPL, and ROAS depend on tracking setup, conversion actions, attribution, and what counts as value.
Channable’s 2026 Google Ads performance benchmark is useful for ecommerce advertisers because it covers CPC, CTR, conversion rate, CPA, and ROAS across Search, Shopping, and Performance Max. Its cohort is over 10,000 anonymized EU and EEA ecommerce accounts, so it should not be treated as a clean proxy for B2B lead gen in the United States.
A benchmark can tell you whether something is unusual. It cannot tell you whether your account is healthy without campaign type, industry, intent, source cohort, and metric definition sitting next to the number.
Google Ads benchmark table: useful ranges, sources, and caveats
Use this table as a first pass before you pull the full industry tables. If you need KPI definitions, keep the marketing metrics glossary open. For wider channel context, the marketing statistics library beats treating Google Ads like it lives alone in a channel silo.
| Metric | Useful baseline or planning range | Source context | Caveat |
|---|---|---|---|
| CTR | 6.64% average CTR | WordStream and LocaliQ 2026 PPC benchmarks, 13,000 plus US-based campaigns, April 2025 through March 2026 | Search-heavy averages do not map cleanly to Display, YouTube, Shopping, PMax, or branded Search. Branded campaigns can make this look low. Cold non-branded campaigns may make it look high. |
| CPC | $5.42 average CPC | WordStream and LocaliQ 2026 PPC benchmarks | CPC shows auction pressure, not performance by itself. Real Estate, for example, shows CPC of $3.22 and CTR of 7.61% in the 2026 LocaliQ search table. Legal, finance, SaaS, and local services often sit in very different auctions. |
| Conversion rate | 8.18% average conversion rate | WordStream and LocaliQ 2026 PPC benchmarks | This depends on what counts as a conversion. A phone call, lead form, booked demo, purchase, and offline-qualified sale are different events wearing the same KPI costume. |
| CPA or CPL | $66.69 average cost per lead | WordStream and LocaliQ 2026 PPC benchmarks | CPL is most useful for lead gen. Ecommerce teams usually need CPA, revenue, margin, and ROAS. Lead quality can make a cheap CPL very expensive. |
| ROAS | Planning range synthesized from Channable ecommerce benchmark data and margin logic, not one universal number | Channable publishes ecommerce Google Ads benchmark ranges for Search, Shopping, Performance Max, and Display across EU and EEA retail accounts | ROAS only works with gross margin, AOV, repeat purchase rate, and return rates. A 3x ROAS can be healthy for one retailer and ugly for another. |
| Impression share | Use account-specific thresholds by campaign role, especially branded Search and priority non-branded terms | Google Ads reports impression share inside the account | Public averages are weak here. Low branded impression share may mean budget or rank problems. Broad prospecting can have low impression share and still be fine. |
| Quality Score and ad relevance | Use 7/10 or higher as a rough internal flag, not a public benchmark target | Google Ads reports expected CTR, ad relevance, and landing page experience inside the account | Quality Score is diagnostic. It is not a business KPI. A keyword can have a weaker score and still produce profitable revenue. |
| Landing page conversion context | 6.6% median landing page conversion rate as external CRO context | Unbounce Q4 2024 data, based on over 41,000 landing pages, 464 million pageviews, and 57 million conversions | Landing page benchmarks are not Google Ads benchmarks by themselves. Traffic intent, offer type, device mix, page speed, and form friction matter. Use our landing page conversion benchmark guide before blaming the campaign. |
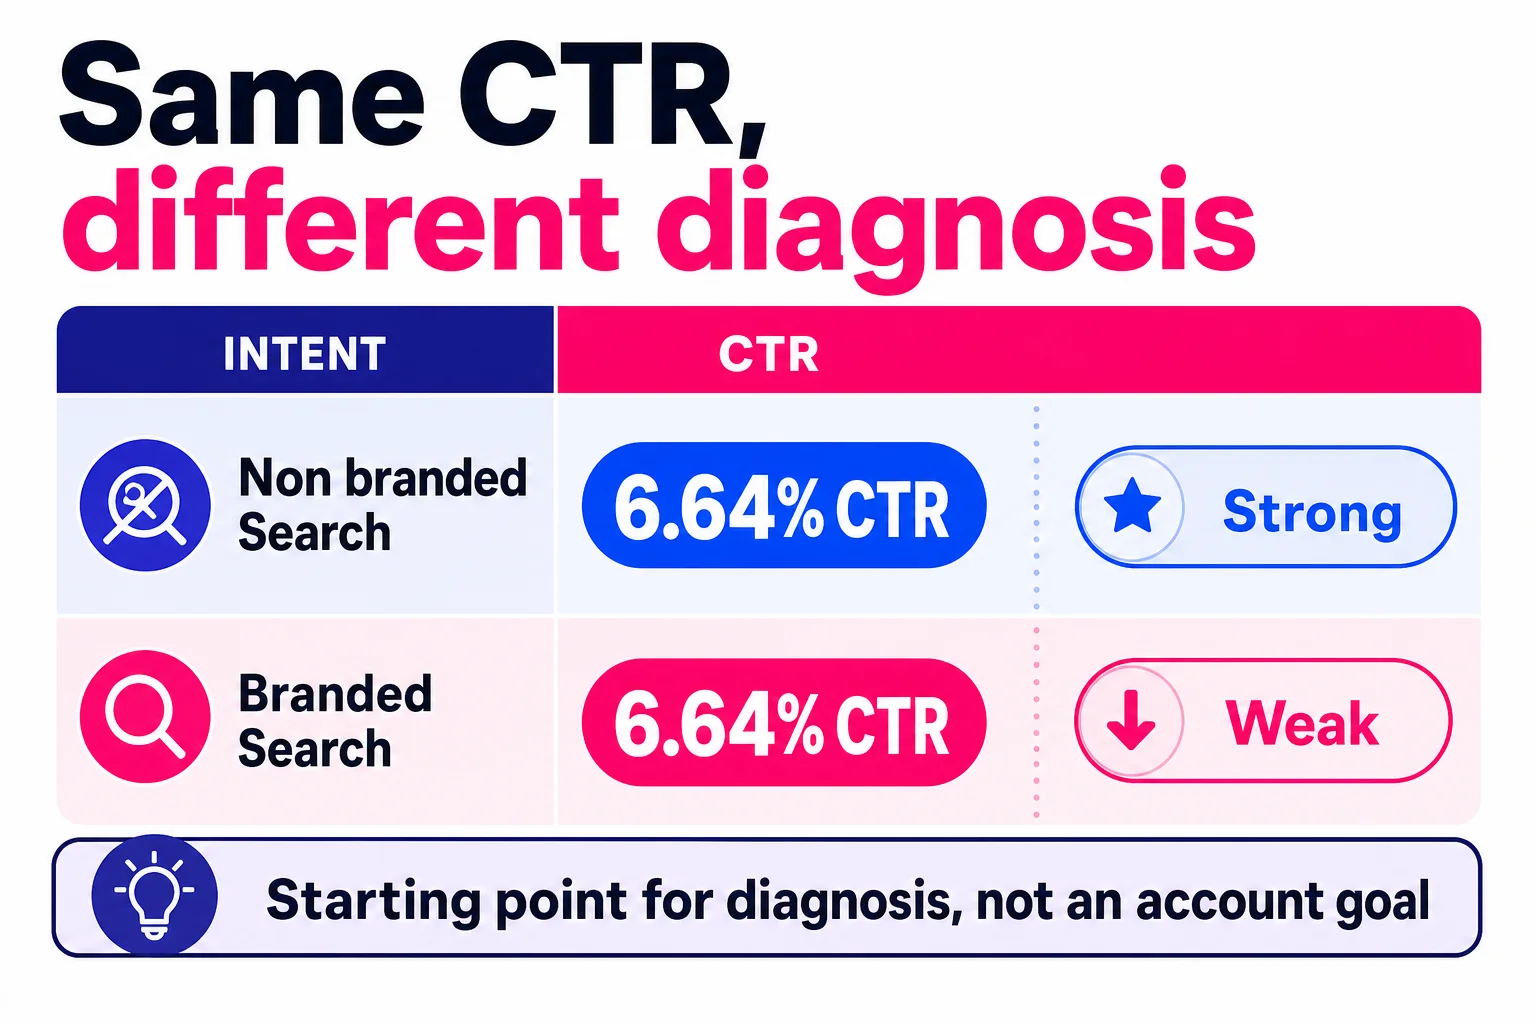
These numbers are starting points for diagnosis, not account goals. For forecasts, pull the exact industry row from the primary source, then adjust for campaign type, branded versus non-branded intent, offer quality, conversion definition, and profit model.
Check the source before you borrow the number
Two Google Ads benchmarks can disagree because they are often measuring different pools of advertisers. A benchmark from US lead gen accounts, a benchmark from EU ecommerce retailers, and a benchmark from a mixed agency client base can all be useful. They should not be averaged together like spreadsheet soup.
WordStream and LocaliQ are useful for broad industry comparisons because their benchmark reports usually give more methodology context, including large advertiser samples, fixed reporting windows, industry groupings, and medians in some studies. Their 2026 benchmark page says the data comes from 13,000 plus US-based campaigns from April 2025 through March 2026, which makes it easier to judge fit. That is good source hygiene. It also means a retailer in Germany running mostly Shopping and Performance Max should be careful before treating that number as THE number.
Channable is useful in a different way. Its Google Ads performance benchmark is closer to ecommerce and feed-based advertising context, which can make it more relevant for retailers than a generic search table. The tradeoff is that the public page gives less detail about sample size, cohort thresholds, time window, and whether metrics are medians, means, or weighted by spend. Useful, yes. Universal truth, no.

Before you apply any Google Ads CPC benchmarks, CTR benchmarks, or conversion rate benchmarks, check seven things: cohort, year, region, campaign mix, customer type, conversion tracking, and methodology. Older benchmark pages can still be useful when they disclose the date range, but they should not override current source data or your own account history.
Compare Google Ads benchmarks by campaign type and intent
Campaign type changes the job of the ad, so it changes the meaning of every benchmark. Search CTR, Shopping ROAS, Display CPC, YouTube view rate, and branded vs. non-branded Search need separate lines before anyone starts judging performance.
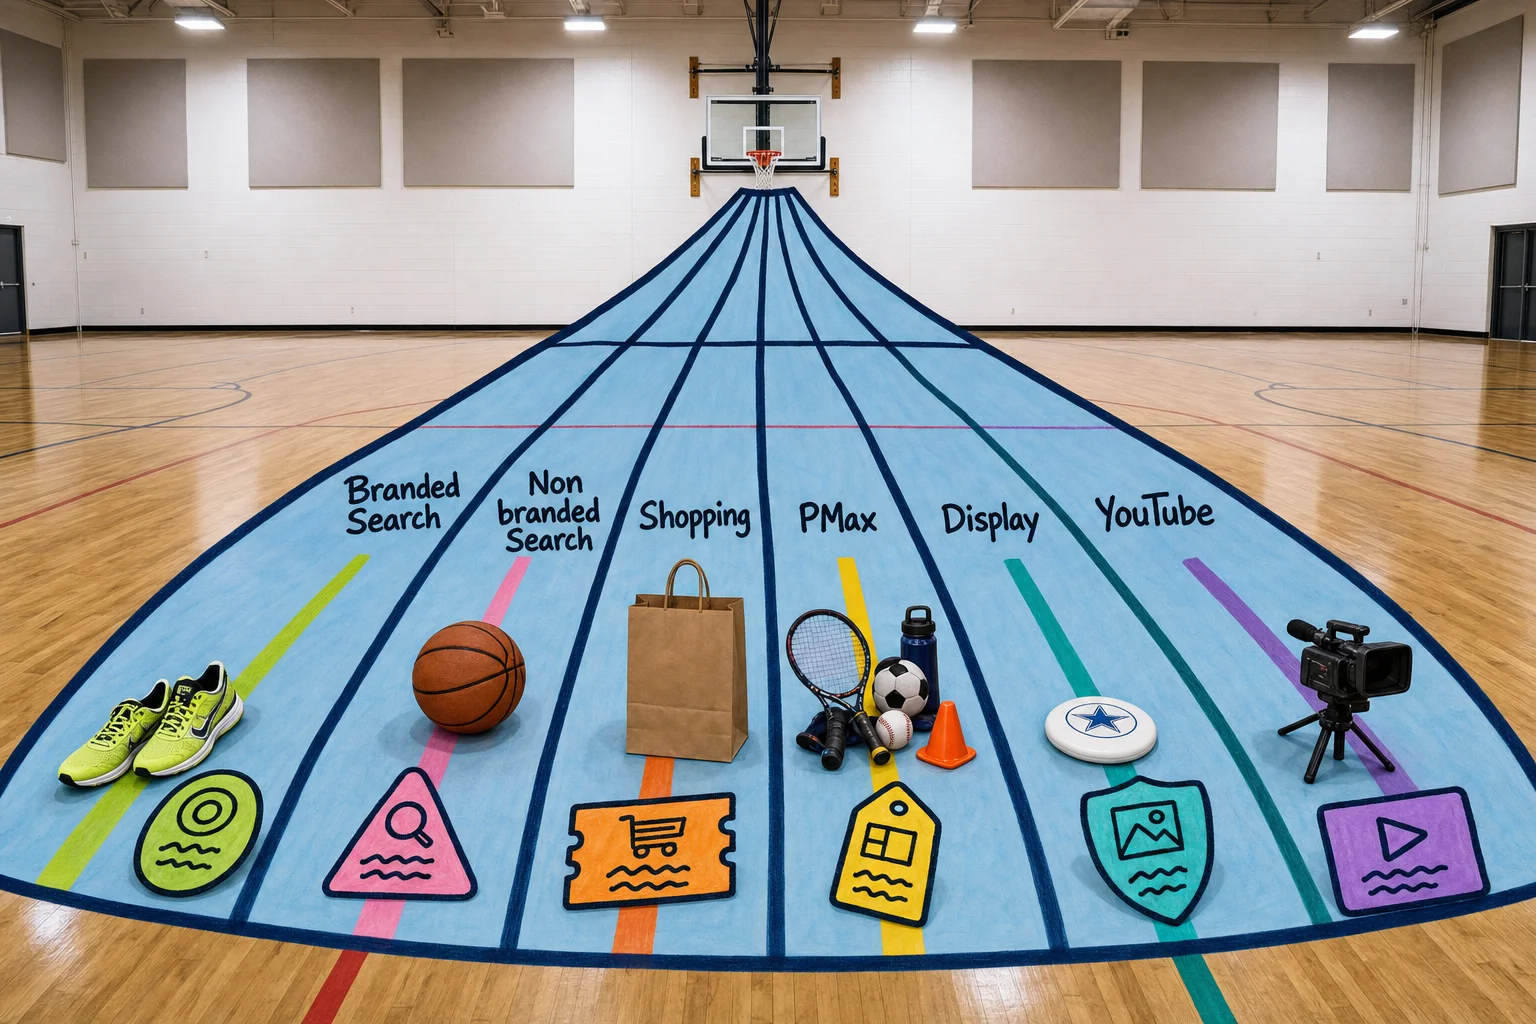
Search campaigns usually sit closest to active demand because the user typed a query. Search often deserves higher CTR and conversion rate expectations than Display or YouTube, especially on commercial terms. Search CPC can look expensive because advertisers are bidding on people already asking for the thing. That may be fine if conversion rate and lead quality hold up. A cheap CPC may still be junk if the query mix is vague, research-heavy, or full of accidental clicks.
Shopping campaigns depend on the product feed, price, images, shipping, reviews, margin, and conversion value tracking. For ecommerce, benchmark Shopping on ROAS, conversion value, impression share, and product-level profitability more than CTR alone. A weak product title, missing GTIN, bad category mapping, or uncompetitive price can make Shopping look like a media problem when the feed is doing the damage.
Performance Max can serve across Search, YouTube, Display, Discover, Gmail, Maps, and other Google inventory from one goal-based campaign. That blended delivery makes PMax CTR and CPC hard to compare with pure Search or Shopping. Use CPA, ROAS, conversion value, and new customer or offline quality signals as the main scorecard. Auction Insights can help, but for Performance Max it reflects impressions from Search and Shopping placements, so it is not a full cross-channel competitor report.
Display campaigns reach people across sites, apps, and other placements where intent is usually lower than Search. Cold Display should have lower direct-response CTR and CVR expectations than high-intent Search. Remarketing Display deserves its own line too. Someone who viewed a pricing page yesterday is not the same audience as a cold in-market segment. Mixing both into one Display average is how dashboards start giving false confidence.
Video campaigns can optimize for awareness, consideration, conversions, or shopping, so YouTube benchmarks need the campaign subtype beside the number. Digital Applied reported a Q1 2026 cross-network average CPV of $0.024 for skippable in-stream ads, while AdConversion reports YouTube in-stream CTR averaging 0.51%, with a typical range of 0.09% to 1.64%. Useful directional checks. Terrible Search CTR targets.
Branded Search usually has higher CTR, higher conversion rate, and lower CPC than non-branded Search because the user already knows the company, product, or category association. Non-branded Search has to fight competitors, aggregators, review sites, and “I’m just researching” behavior. Keep branded and non-branded campaigns separate in benchmark tables, forecasts, and client reporting, or branded demand will make Search look healthier than it is.
How to interpret each Google Ads metric without fooling yourself
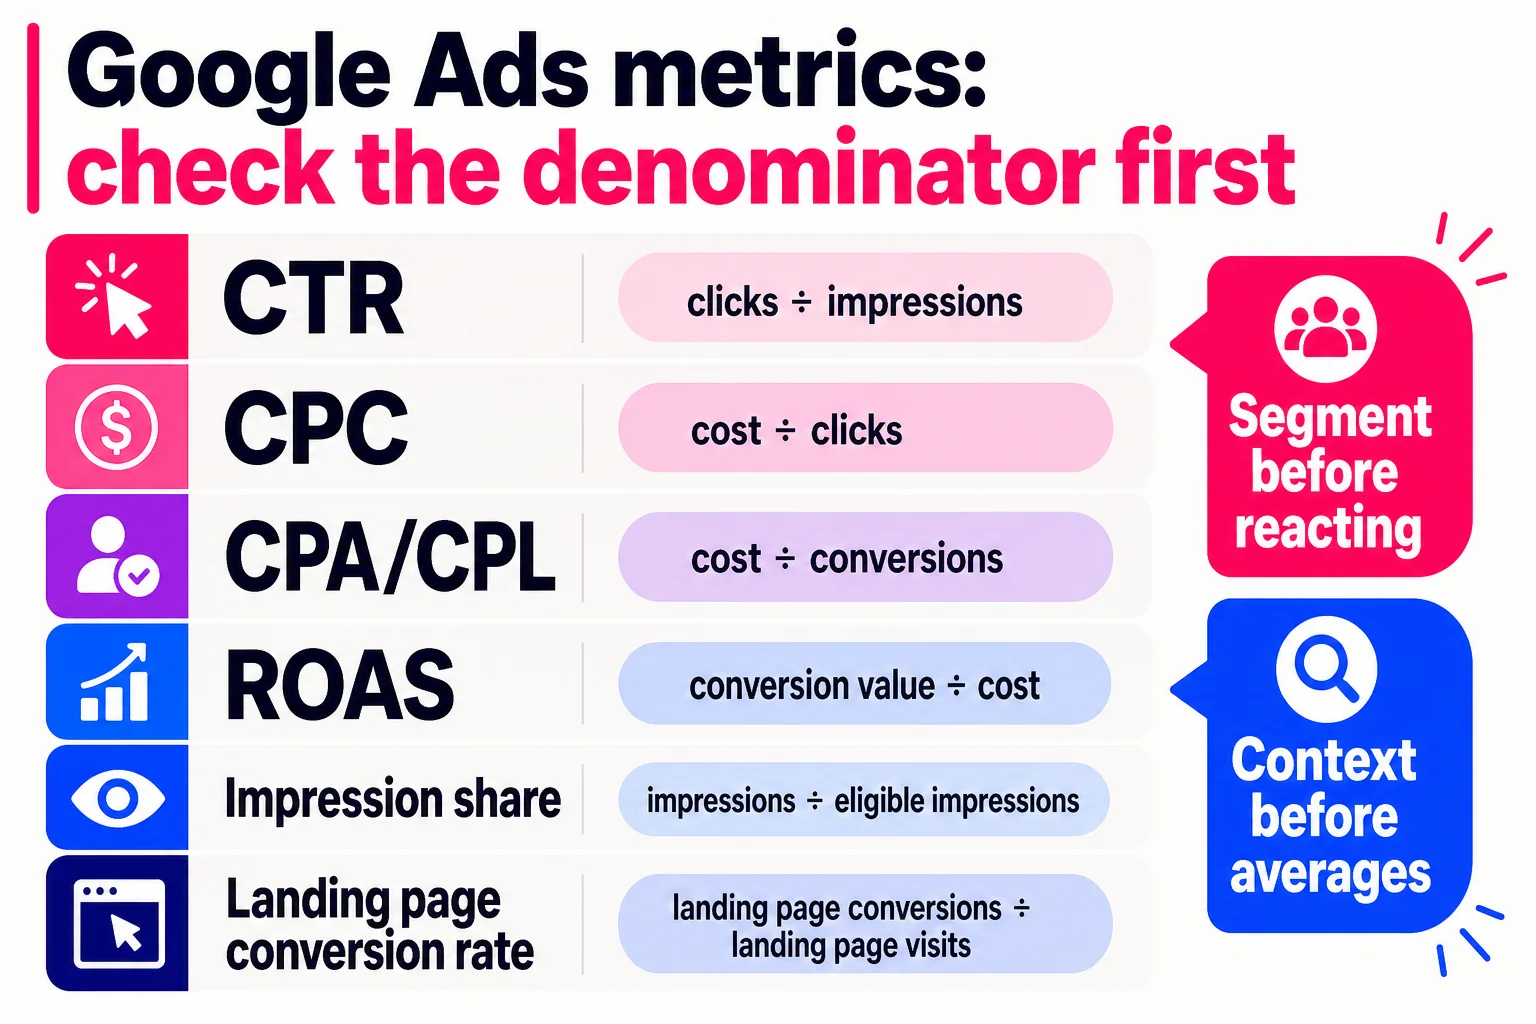
Read every metric with its denominator attached, or you will end up optimizing the dashboard equivalent of a shortcut.
CTR is clicks divided by impressions. Google defines clickthrough rate as how often people click after seeing an ad, but CTR is engagement, not revenue. High CTR can mean tight message match, or broad curiosity copy that attracts weak leads. Segment by network, brand vs. non-brand, match type, and query intent. Then compare CTR with conversion rate and qualified lead rate.
CPC is cost divided by clicks. High CPC can mean a competitive auction, stronger intent, or weak Ad Rank. Low CPC can mean cheap traffic that never buys. WordStream’s 2026 data shows the spread: Arts & Entertainment averaged $1.63 CPC while Attorneys & Legal Services averaged $9.87. Judge CPC against revenue per click or lead value, not vibes.
Conversion rate is conversions divided by clicks or interactions, depending on the report. A low rate may point to poor landing page match, weak traffic, broken tracking, or a conversion action that asks too much. Segment by conversion action, campaign type, device, landing page, and new vs. returning users before rewriting every ad.
CPA and CPL are cost divided by tracked conversions. Google reports this as cost per conversion. A low CPA is less exciting when every “lead” is a student, vendor, competitor, or low-quality junk. Segment by lead stage, offline outcome, form type, call quality, and sales-qualified lead rate. Import offline conversions if you can. At minimum, report CPA beside qualified lead rate. The broader definitions live in our guide to marketing metrics.
ROAS is conversion value divided by ad cost, the same formula Google uses for conversion value divided by cost. High ROAS can hide branded demand, repeat buyers, missing costs, or low-margin products. Compare ROAS with contribution margin.
Impression share is impressions received divided by eligible impressions. Lost to budget means constrained delivery, while lost to rank points to Ad Rank, bids, or quality. If budget is the limit, decide whether the campaign deserves more spend. If rank is the issue, inspect bids, ad relevance, and landing page fit.
Quality Score and ad relevance are keyword-level diagnostics built around expected CTR, ad relevance, and landing page experience. Low scores can raise costs or limit visibility. High scores do not guarantee profit. Fix ad groups where the keyword, ad, and page all say different things.
Landing page conversion rate is conversions divided by landing page visitors or sessions, depending on your analytics setup. Use it beside Google Ads CVR because clicks, sessions, and conversions do not always line up cleanly. Compare your page with a relevant landing page conversion benchmark and prioritize the largest friction points. For broader CRO context, see our conversion rate optimization statistics.
Adjust benchmarks for the market, the offer, and the conversion
Industry tables help because auctions follow customer value. WordStream and LocaliQ report 2026 search averages of 6.64% CTR, $5.42 CPC, 8.18% CVR, and $66.69 CPL, but legal, pets, auto repair, and apparel have different margins, sales cycles, and lead values. Use those rows as a sanity check, then compare against broader marketing benchmarks.
The ask matters too. A coupon signup, quote request, demo, purchase, phone call, and offline sale will not convert at the same rate. Pair CPL with qualified lead rate, pipeline value, and close rate, because a cheap lead can still waste sales time. Our lead generation statistics page adds context.
For ecommerce, Channable’s EU and EEA benchmark is useful, but ROAS still needs margin. At 40% gross margin, breakeven ROAS is 2.5x.
Turn benchmarks into planning assumptions and review guardrails
Use Google Ads benchmarks in forecasts, audits, and reporting. For forecasts, keep the math visible and label it as a planning model. Google’s docs on conversion tracking and Smart Bidding are good reminders that bidding depends on clean conversion data.
Planning mechanics, not predictions

clicks = budget / CPC
conversions = clicks x CVR
CPA = spend / conversions
ROAS = revenue / spend
For audits, compare each metric against the right cohort, then find the bottleneck. Weak CTR points to query, audience, offer, or ad relevance. High CPC points to auction pressure, Quality Score inputs, or targeting. Weak CVR points to offer fit, page intent, tracking, or sales friction. Use your own marketing metrics definitions before numbers hit a client deck.
Before using benchmarks, answer yes or no:
- Campaign type separated?
- Branded traffic separated?
- Industry source checked?
- Conversion action defined?
- Attribution window known?
- Landing page benchmark reviewed with landing page conversion benchmarks?
- Lead quality reviewed?
- Margin or LTV included?
- Source cohort documented?
Use benchmarks as sanity checks. Set targets from your economics, history, and source limits documented in your marketing benchmarks and marketing statistics notes.