
Google Ads stats marketers can use first
| Statistic | Latest source | Use it for | Caveat |
|---|---|---|---|
| Search CTR, CPC, CVR, CPL | WordStream/LocaliQ reports a 2026 average CTR of 6.64%, CPC of $5.42, conversion rate of 8.18%, and CPL of $66.69, based on 13,474 US search campaigns from April 2025 through March 2026. | Planning ranges, budget models, channel forecasts. | Search benchmarks do not map cleanly to Display, YouTube, Shopping, or Performance Max. |
| Google Ads conversion rate and CPL | A separate WordStream page reports an average Google Ads conversion rate of 7.52% and cost per lead of $70.11. | Cross-check lead-gen targets. | Different methodology, so do not blend the numbers casually. |
| 2026 performance direction | WordStream reports conversion rates rose for 87% of industries in its 2026 benchmark cycle. | Explain year-over-year movement in planning decks. | Industry mix matters more than the overall average. |
| Quality Score | Google describes Quality Score as a 1 to 10 diagnostic based on expected CTR, ad relevance, and landing page experience in Google Ads help. | Diagnose keyword-level ad quality issues. | ”Good” ranges are third-party interpretations, not Google targets. |
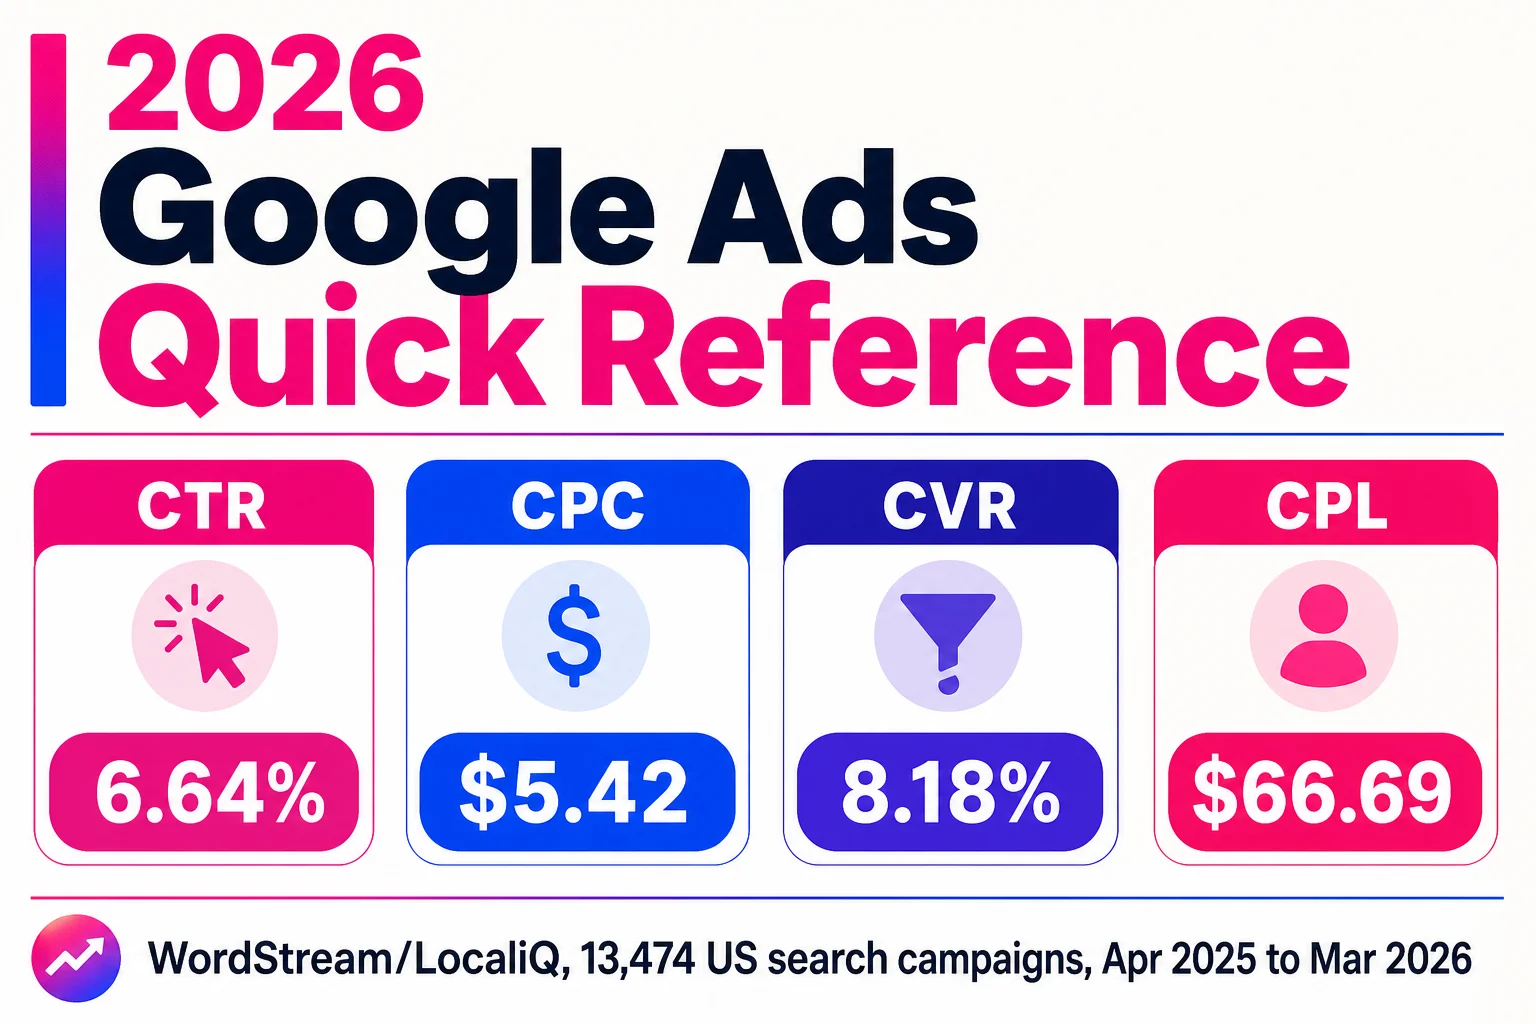
Use this page for source-aware Google Ads stats. Use Google Ads benchmarks for deeper industry tables, PPC statistics for broader PPC data, and marketing statistics or digital marketing statistics for wider context.
Why Google Ads needs its own statistics page
Google Ads gets its own page because it answers a specific budget question: how much should we pay to capture demand from people already searching, shopping, comparing, or ready to convert? That is a different job than reporting paid social reach, creator spend, or broad PPC averages.
Public “PPC statistics” pages often blend Google Ads, Microsoft Ads, paid social, Display, and marketplace ads into one bucket. Fine for a board slide. Messy when a team is setting bids, forecasting pipeline, or comparing channel performance in a digital marketing metrics review.
Scope matters. Google parent-company revenue is not automatically a Google Ads performance stat. Google Search data is not automatically a Search campaign benchmark. A US benchmark may not apply to the UK, Canada, or APAC. Even the widely cited WordStream/LocaliQ 2026 search benchmark dataset includes Google Ads and Microsoft Ads search campaigns, so treat those figures as paid search context unless the source says Google-only.
Use cross-industry numbers as sanity checks. For target-setting, pull vertical, format, and device context from marketing benchmarks and campaign-specific reports. Device mix alone can distort the read: one 2026 summary reports mobile generates 65% of Google Ads clicks but 47% of conversions.
Google Ads ROI claims need a skepticism filter
Google has historically claimed that advertisers earn a positive average return from Google Ads. Treat that as a market signal, not a forecast. It does not belong in the spreadsheet cell where your CFO expects pipeline math to behave.
Google Ads ROI statistics get messy because return depends on margin, sales cycle, tracking quality, close rate, repeat purchases, and landing page performance. A campaign can show strong in-platform ROAS and still miss profit targets if the product margin is thin or sales follow-up is weak. Post-click performance matters too, so CRO data belongs beside media data when you review conversion rate optimization statistics.
| ROI/ROAS stat | What it measures | What it does not prove |
|---|---|---|
| Google-published ROI claim | Google’s historical estimate of average advertiser return | Your account will earn that return |
| Account-level ROAS | Revenue attributed to ad spend inside your tracking setup | Profit, incrementality, or cash flow |
| Benchmark ROAS | A comparison point across sampled advertisers | Fit for your vertical, funnel, or margin model |
Use ROI claims as a confidence check, then build forecasts from your own conversion rate, average order value, gross margin, and sales cycle.
Search benchmarks for CTR, CPC, CVR, and CPL
Search benchmarks help with planning, diagnosis, and explaining performance to people who do not live inside Google Ads all day. Treat them as directional, not targets handed down from the mountain in a blazer.
| Metric | Definition | Best use | Common misread |
|---|---|---|---|
| CTR | Clicks divided by impressions. Google defines CTR as how often people click after seeing an ad. | Judging ad relevance and query fit. | High CTR always means profitable traffic. |
| CPC | Cost divided by clicks. Google defines average CPC as the amount paid per click on average. | Forecasting budget and auction pressure. | A cheap click is automatically a good click. |
| CVR | Conversions divided by clicks. | Checking landing page and offer performance. | CVR explains the whole account. It does not. |
| CPL | Cost divided by leads. | Planning lead-gen efficiency and pipeline economics. | Low CPL means good lead quality. Sales teams would like a word. |
For current Search benchmarks, start with recent LocaliQ Search advertising benchmarks and WordStream benchmark sets. Use CTR to estimate traffic from impressions, CPC to forecast spend, CVR to model lead or sale volume, and CPL to compare acquisition cost against sales economics.
The caveats matter. Branded, nonbrand, and competitor terms should not share one CTR expectation. CPC changes with industry competition, match types, Quality Score, geography, device, and auction-time signals. CVR depends heavily on conversion tracking quality. CPL is incomplete without lead quality, close rate, and margin.
For full industry rows, use ClickMinded’s Google Ads benchmarks. For broader PPC statistics across platforms, use PPC statistics.
Use separate benchmarks for non-Search campaigns
Do not paste Search CTR, CPC, CVR, or CPL onto Display, YouTube, Shopping, or Performance Max. Search captures expressed demand. These campaigns work with different intent, formats, placements, and attribution.
| Campaign type | Better primary reads | Why Search benchmarks mislead |
|---|---|---|
| Display | View-through conversions, assisted conversions, CPA, placement quality | Lower click intent can make CTR and CVR look worse than the campaign is |
| YouTube | Views, engaged-view conversions, lift, CPA | Click-based metrics miss video influence |
| Shopping | ROAS, CPA, conversion value | Feed quality, price, reviews, and Merchant Center health can swing results |
| Performance Max | ROAS, CPA, conversion value by goal, asset group, feed type, and conversion quality | PMax runs across multiple Google channels, so channel-level reads get messy |
Use PPC statistics for broader paid media comparisons and digital marketing metrics to match metrics to the campaign’s job.
Read automated campaign stats as system outputs
Automation changes what Google Ads statistics mean. Smart Bidding, broad match, responsive search ads, and Performance Max shift diagnosis away from keyword-by-keyword control and toward inputs: conversion quality, audience signals, creative assets, landing page fit, and account structure. Google describes Smart Bidding as using auction-time signals to optimize for conversion or conversion value goals, so bad tracking can make a campaign look smart while it chases junk.
| Automation feature | Metric it can affect | Reporting risk | Practical check |
|---|---|---|---|
| Smart Bidding | CPA, ROAS, conversions | Efficient-looking results from weak conversions | Audit primary conversions and value rules |
| Broad match | CTR, CPC, search terms, CPA | Query mix shifts faster than keyword reports suggest | Review search terms and negatives |
| Responsive search ads | CTR, conversion rate | Asset ratings hide weak messaging | Check asset ratings and message match |
| Performance Max | ROAS, CPA, conversion value | Runs across multiple Google channels, so blended numbers can mask inventory differences | Segment by asset group, feed, goal, and conversion type |
Post-click performance changes the economics
Quality Score can flag relevance, expected CTR, and landing page experience, but Google says it is not a key performance indicator and is not used directly in the ad auction. Treat it as a clue, not the whole crime board.
A “good” CPC can still lose money when the page converts poorly or lead quality is weak. A higher CPC can work when conversion rate, close rate, and LTV support the math. Use landing page conversion benchmarks and CRO statistics to check what happens after the click.
| Lever | Metric affected | Practical action |
|---|---|---|
| Landing page experience | Quality Score, CVR | Match page intent to query |
| Conversion rate | CPA, ROAS | Test offer and form friction |
| Lead quality | LTV, ROAS | Optimize for qualified outcomes |
Check the tracking before you trust the stats
Google Ads statistics get shaky when conversion setup is messy. Audit tracking before comparing against digital marketing metrics or marketing benchmarks.
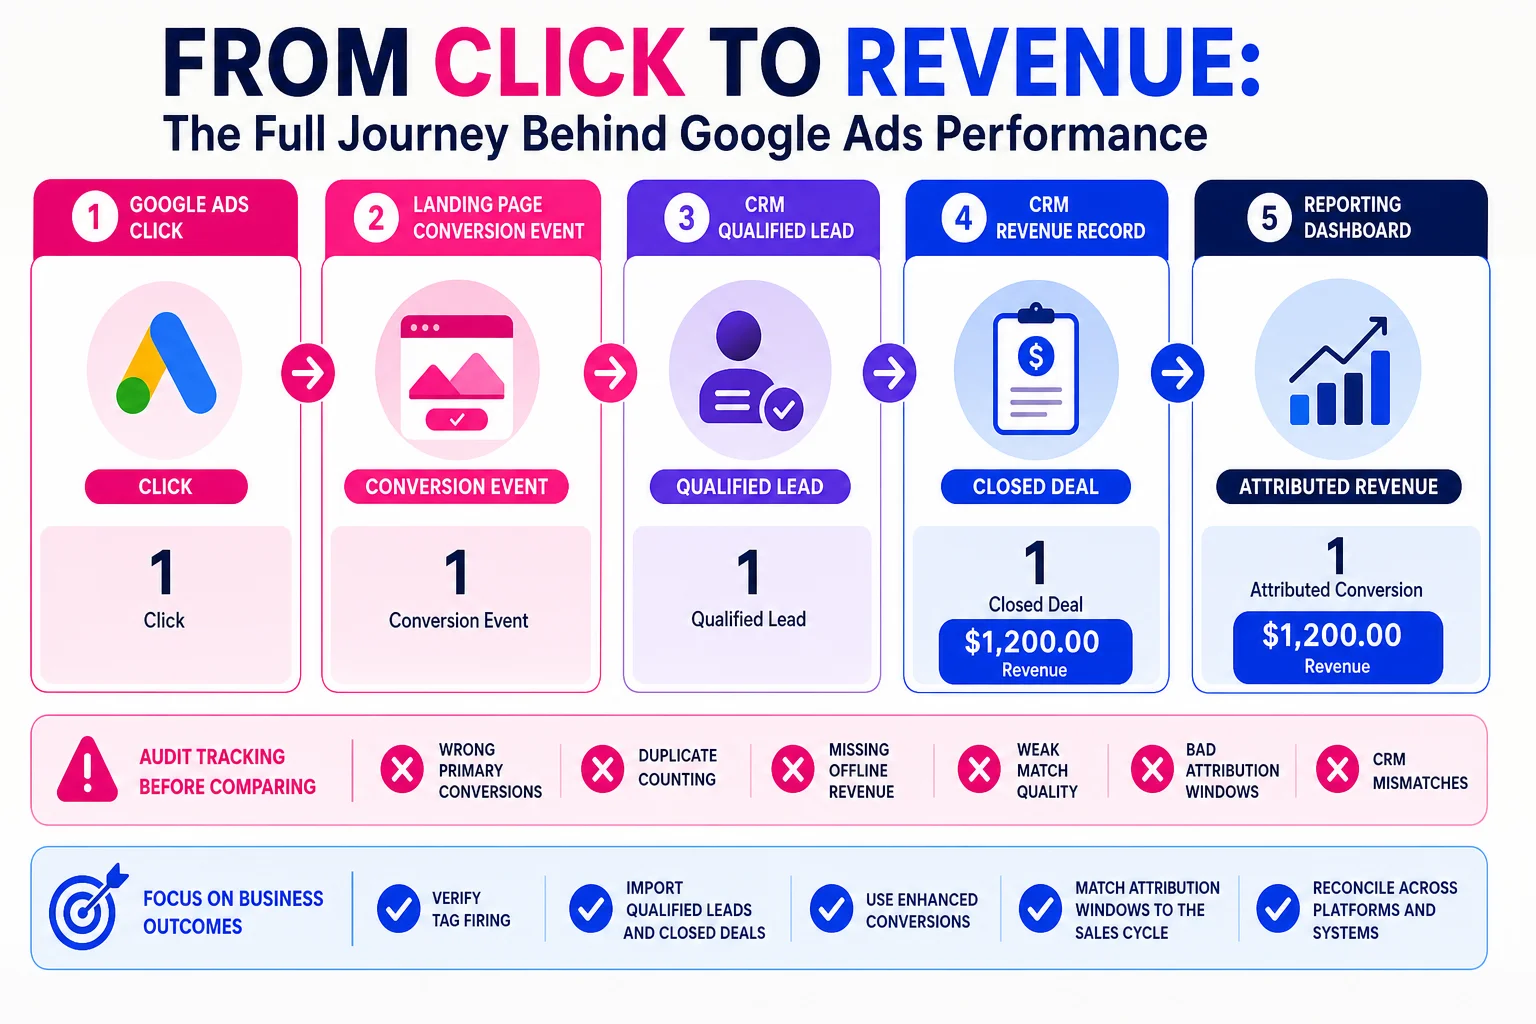
Check for wrong primary conversions, duplicate counting, missing offline revenue, weak match quality, bad attribution windows, and CRM mismatches. Keep business outcomes primary, verify tag firing, import qualified leads and closed deals, use enhanced conversions, match attribution windows to the sales cycle, and reconcile IDs, stages, and refunds.
Most useful Google Ads statistics for 2026? CTR, CPC, CVR, CPL, ROAS, impression share, and qualified lead rate.
Good CPC or CTR? Use industry and campaign-type benchmarks, then judge against margin and close rate.
Are ROI stats reliable? Only when tracking includes revenue quality.
Google Ads vs. PPC statistics? PPC statistics are broader. Use Google Ads benchmarks for campaign-type comparisons.