
Digital marketing statistics 2026 by channel
Digital marketing statistics are useful only when the channel is clear. SEO, PPC, paid social, organic social, email, SMS, content, video, affiliate, reviews, CRO, analytics, marketing tech, and budget planning all behave differently. Treating them as one bucket is how marketers end up with a Frankenstein benchmark that looks tidy in a slide deck and falls apart the second someone asks, “For which channel?”
ClickMinded already has a broader marketing statistics hub for general marketing planning. If you need definitions and reporting logic, use marketing metrics and digital marketing metrics. If you need performance ranges and comparison points, use marketing benchmarks. For paid search context, use PPC statistics and Google Ads statistics. This page has a narrower job: organize current digital marketing stats by channel and by the decision you are trying to make.
That distinction matters because the current search results are messy. HubSpot’s marketing stats hub pulls together social media, content, email, SEO, AEO, sales, and general marketing trends on one page. Salesforce’s marketing statistics coverage mixes marketing, AI, customer data, personalization, and operations. Agency roundups such as Forge Apollo’s “Top 44 Digital Marketing Statistics to Know for 2026”, SeoProfy’s digital marketing statistics, and Incremys’ digital marketing stats are helpful, but they often mix adoption stats, ROI claims, AI usage, search behavior, and platform trends without making the planning decision obvious.
This guide keeps the focus on digital channels. You will see digital marketing stats 2026 grouped around practical questions: where budgets are moving, which channels marketers are adopting, how ROI claims differ by source, how AI affects workflows, how paid and organic channels compare, where email and SMS fit, how social and video performance should be read, and where measurement data is still thin.
We will cite exact figures inline and flag source-labeled caveats when a stat comes from a vendor or roundup with limited methodology. You will not get one universal digital marketing benchmark here, because that benchmark would be fake. A paid search conversion rate, an email ROI claim, an SEO traffic share, and a TikTok engagement rate are different planning inputs. Use them that way.
Digital marketing statistics summary table
Use this as the quick scan layer. Treat each number as a channel input, then click through before dropping it into a forecast, pitch deck, or budget model.
| Decision area | Stat | What it means | Best source or next page |
|---|---|---|---|
| Budget | Global digital marketing industry spend is projected to top $800 billion by 2026, based on Entrepreneurs HQ’s roundup. | One “digital marketing” line item hides paid search, paid social, SEO, email, content, video, CRO, and analytics. Split the budget before debating performance. | Use the budget section, then compare against marketing benchmarks and marketing metrics. |
| Adoption | 2026 roundups from BizIQ, SeoProfy, Forge Apollo, and Incremys group budget, AI, SEO, PPC, social, email, content, and measurement as core planning areas. | ”Digital marketing” is too broad to plan against by itself. Pick the channel that matches the goal. | Start with this hub, then route by channel below. |
| ROI | Omnichannel brands achieve 89% customer retention compared with 33% for single-channel approaches, per BizIQ’s cited roundup. | Retention claims are strongest when email, SMS, search, social, paid media, and analytics connect to the same customer record. Treat this as a planning cue unless you can verify the original method. | Use the measurement section, then marketing metrics. |
| AI | AI adoption and marketing automation are major 2026 planning topics in Salesforce’s State of Marketing coverage and AI marketing roundups. | Judge AI by workflow: ad testing, content drafts, segmentation, personalization, reporting, and the boring review step everyone pretends will magically vanish. | Go to AI marketing statistics. |
| Paid media and PPC | Paid search, paid social, display, shopping, and retail media benchmarks vary by platform, industry, and offer. | CPC, CPA, CTR, CVR, and ROAS should not be mashed into one “digital advertising” benchmark. That is spreadsheet theater with extra steps. | Go to PPC statistics. |
| Organic search | SEO stats are best read by search behavior, ranking distribution, click behavior, content investment, and AI search changes. | Organic performance usually compounds over time, so compare it differently from auction-based paid media. | Go to SEO statistics and content marketing statistics. |
| Email and SMS | Email, SMS, and lifecycle channels sit closer to retention and owned audience performance than top-of-funnel reach. | Open rates, click rates, unsubscribe rates, revenue per recipient, and list growth answer different questions. Match the metric to the decision. | Go to email marketing statistics. |
| Social | Social stats should separate audience adoption, organic reach, paid social performance, creator activity, and social commerce. | Platform size does not guarantee brand ROI. A huge audience can still be a bad fit for your offer, budget, or creative capacity. | Go to social media statistics. |
| Video | Video stats are most useful when grouped by use case: awareness, education, product proof, ads, webinars, landing pages, and social distribution. | Completion rate, watch time, click-through rate, and assisted conversion matter in different places. | Go to video marketing statistics. |
| Content | Content marketing metrics and ROI remain core 2026 planning topics in roundups from Digital Applied, The Digital Elevator, and Genesys Growth. | Content is usually measured through search visibility, lead quality, assisted conversion, sales enablement, and retention support. Pick the role before judging the result. | Go to content marketing statistics. |
| Measurement | Integrated measurement and omnichannel reporting show up repeatedly in 2026 digital marketing statistics roundups, including BizIQ’s digital marketing statistics. | Attribution is where channel stats get abused. Use benchmarks to form assumptions, then replace them with your own CRM, analytics, and ad platform data. | Use marketing metrics and the measurement section below. |
AI and automation stats for digital channel planning
AI sits across the digital marketing stack: content briefs, ad variants, email segmentation, chatbot routing, reporting, predictive scoring, landing page testing, and creative QA. For a deeper stat bank, use ClickMinded’s AI marketing statistics page, then come back here to place those numbers inside channel plans.
Adoption is the easy part to measure. Salesforce’s marketing statistics page reports that 63% of marketers are currently using generative AI. A Salesforce 2026 analysis also says 75% of marketers have adopted AI, while 84% still run generic campaigns. Those two numbers belong in the adoption bucket. They show that AI tools are common, but they do not prove that campaigns are better.
The workflow trend is sharper when you look across years. Omnibound’s summary of Salesforce State of Marketing surveys says generative AI use in at least one recurring workflow rose from 51% in Q1 2024 to 76% in Q1 2025 and 87% in Q1 2026. Treat that as a planning signal for staffing and operations. If your agency or in-house team still has every brief, first draft, UTM check, report summary, and ad variation moving through manual review, the bottleneck is probably process design before it is tool choice.

Outcome claims need more caution. Omnibound reports that AI-driven campaigns deliver 22% higher ROI, 32% more conversions, and 29% lower customer acquisition costs than non-AI campaigns, but that is a secondary summary and the methodology is not visible on the cited page. Use it as a directional citation, not as a promise you can paste into every PPC, SEO, email, or social forecast.
The counterweight comes from enterprise implementation data. IBM’s State of Salesforce 2025 to 2026 report says only 33% of AI initiatives are meeting ROI targets, and 72% have failed to scale across business units. Salesforce also reports that only 58% of marketers have complete access to service data, 56% to sales data, and 51% to commerce data, while 98% hit barriers to personalization.
For founders, agencies, and marketing leaders, the practical read is boring but useful: plan AI around repeatable workflows, data access, review standards, and reporting expectations. AI can help a channel team move faster, but channel strategy still decides what to create, who sees it, what offer is tested, and which metric proves the work mattered.
SEO, search, content, and video marketing statistics
Search is still where people go when they need an answer, product, comparison, or vendor shortlist. The planning stat is demand: 68% of online experiences begin with a search engine. Instant Press also reports that Google holds about 89% of the global search market and processes an estimated 8.5 billion searches per day, though that daily search number is an industry estimate, not a current Google dashboard metric.
Traffic expectations need more caution. Instant Press summarizes that roughly 53% of all website traffic comes from organic search, and Ahrefs reports that SEO drives 1,000%+ more traffic than organic social media. Helpful for channel planning, yes. A forecast for your site, absolutely not.
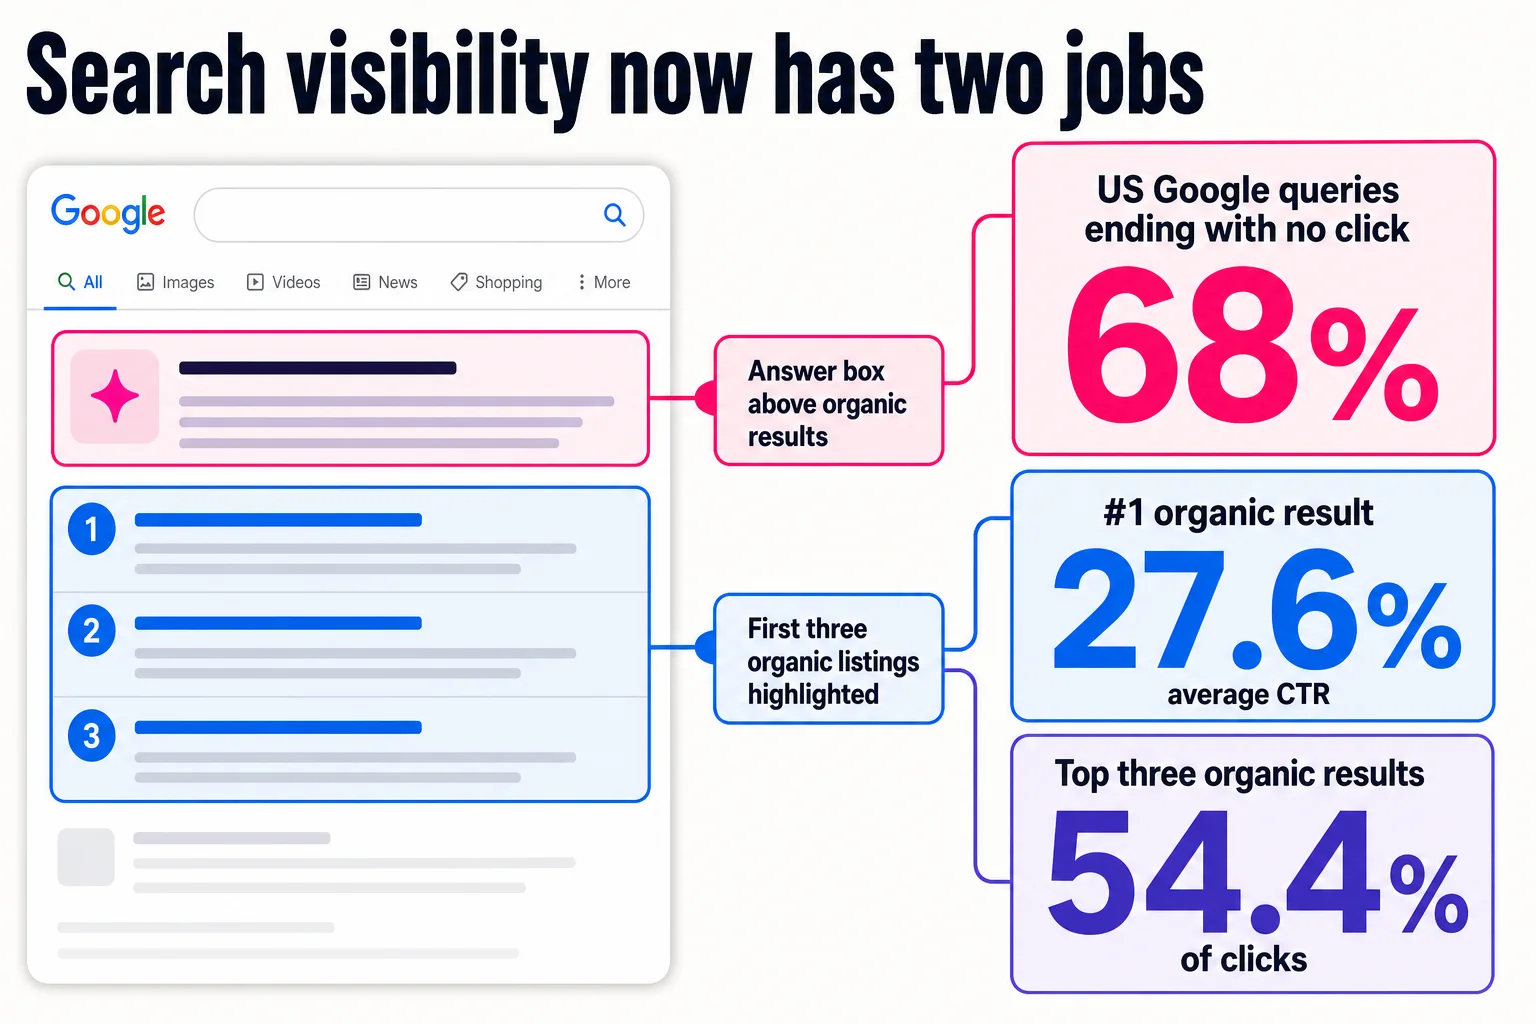
Organic results vary by industry, intent, funnel stage, brand demand, content quality, technical health, SERP layout, and whether Google answers the query on the results page. That last part is a big deal because 68% of US Google searches end with no click. Ranking still matters, but measurement has to include impressions, branded search lift, assisted conversions, and visibility across SERP features.
Ranking position remains one of the cleaner benchmarks. Instant Press reports that the number one organic result earns a 27.6% average click-through rate, while the top three results capture 54.4% of clicks. That is why moving from position 8 to position 3 is a different business case than moving from position 38 to position 22.
Content is the work that makes organic discovery possible across search, email, social, sales enablement, and video. SeoProfy reports that around 70% of B2B and B2C marketers use content marketing as a key tactic. That explains why content is a normal budget line now, but it does not tell you whether your best next asset is a blog post, comparison page, template, webinar, or video series.
Voice search is a planning signal for local, how-to, and question-led content. HubSpot reports that 73.7% of marketers plan to maintain or increase investment in voice search optimization this year. For many teams, that means clearer answers, stronger FAQ coverage, better local data, and pages that match natural-language queries, not a separate “voice search program” with its own tiny throne.
Video sits between content, search, social, and conversion. Keep audience usage stats separate from performance benchmarks, or the numbers turn into soup. The safer organic use case is page-level engagement: video can help when a topic benefits from demonstration, comparison, or explanation, and when the page still satisfies search intent.
For deeper planning, use ClickMinded’s SEO statistics, content marketing statistics, and video marketing statistics pages.
Digital advertising statistics for paid media planning
Digital advertising statistics are useful when they help you answer a paid media planning question: how much will traffic cost, how many clicks will convert, where should budget go, and when does a channel deserve more money?
Paid search is the cleanest place to see cost pressure. Rudys.AI reports that the overall average Google Search Ads CPC in 2025 was $5.26, up 12.88% year over year. That does not mean your next click will cost $5.26. Legal, insurance, B2B software, local services, ecommerce, branded search, and competitor campaigns all behave differently. The planning takeaway is simpler: competitive search auctions are more expensive than they were a few years ago.
Historical data makes that clearer. Older WordStream benchmark data reported an average CPC of $2.69 for search and $0.63 for display, with a 3.75% search conversion rate and $48.96 average search CPA. Current benchmark collections show higher costs, while also showing better conversion rates in some categories. WordStream’s 2026 Google Ads benchmarks report an average CTR of 6.64%, average conversion rate of 8.18%, and average cost per lead of $66.69, with CPL down year over year for the first time in five years in its dataset.

Spend is still moving into auction-based channels. A 2026 Google Ads benchmark consolidation estimates Google Ads advertiser spend at about $224 billion in 2025, with projections above $248 billion in 2026. Treat that as directional because the report aggregates multiple sources, including WordStream, Search Engine Journal, Statista, and agency databases. It is useful for sizing the channel, not for building a month-one CPA target.
Shopping and retail media need their own caution label. Product category, feed quality, price competitiveness, reviews, shipping terms, merchant reputation, and promo timing can move performance as much as the platform itself. A strong shopping campaign for a known brand with clean product data is a different thing from a new store bidding into a crowded category with thin margins.
Paid social, display, remarketing, programmatic, and creator amplification should be judged by role. Some campaigns buy demand. Some capture demand. Some retarget visitors who already know the brand. Some test creative before search volume exists. ROAS gets messy fast when a click assists a later branded search, retail marketplace purchase, or sales conversation.
Use ClickMinded’s PPC statistics page when you need deeper paid search and paid media benchmarks by channel. For planning, keep benchmarks labeled by platform, industry, source, date, and caveat. Paid benchmarks change with auction dynamics, seasonality, geography, creative, offer, and landing page quality. A blended CPC or ROAS number across all digital advertising is spreadsheet confetti.
Social media statistics for digital distribution and commerce
Social belongs in a digital marketing statistics hub because it touches several jobs at once: distribution, community, discovery, customer support, paid reach, creator partnerships, and commerce. The mistake is treating all of that as one channel with one scorecard.
Usage data shows why marketers keep social in the plan. DataReportal’s Kepios analysis estimates that typical users spend about 18 hours and 36 minutes per week on social platforms, including social networks and online video, and actively visit an average of 6.5 different social platforms per month. That overlap matters. Your audience may see you on TikTok, check reviews on YouTube, follow you on Instagram, ignore your LinkedIn post, and convert later through search or email. Annoying for attribution. Very normal for humans.

Use those numbers as planning estimates, not clean audience counts. DataReportal notes that social media figures often represent user identities rather than unique individuals, so one person with multiple accounts can inflate reach. Country reports, including the Digital 2026 United States report, also rely on platform ad tools and Kepios modeling. That is useful for sizing a market. It is not a census.
Organic social and paid social also need separate reporting. Organic social is better judged by audience fit, repeat engagement, community response, saves, shares, comments, creator pickup, and assisted demand. Paid social needs campaign-level metrics like CPM, CTR, CPA, ROAS, holdout results, and creative fatigue. A funny organic post with a high save rate and a conversion campaign with a strict CPA target are doing different jobs. Please do not make them fight in the same spreadsheet cell.
Social commerce stats are useful for discovery and consideration, especially when product content, creators, comments, and checkout paths sit close together. But social commerce behavior does not prove that social is the best last-click revenue channel for every brand. Platform-reported sales, survey-based purchase intent, and ecommerce analytics can all tell different stories.
For deeper platform usage, engagement, demographics, and reporting caveats, use ClickMinded’s social media statistics page.
Owned audience and trust statistics for email, SMS, retention, affiliates, and reviews
Email and SMS sit in a different bucket from social, search, and paid media because the audience is known, permissioned, and reachable without buying every impression again. That does not make the audience free. Bad deliverability, weak consent, and lazy sending can burn a list fast.
Email still has unusually strong reach. ZeroBounce reports that 93% of people use email every day and 42% check their inbox three to five times per day. It also says 41% check email specifically to look for brand discounts, which helps explain why ecommerce teams keep sending offers even when everyone claims to hate promotional email.
Benchmarks vary by dataset, so treat them as list-quality clues, not universal targets. PushOwl reports that Shopify email programs see a 32.67% average open rate, 2.86% average click-through rate, and automated emails drive 13x more orders than promotional campaigns. Broader 2025 benchmarks put average open rates around 42% to 43% and click-through rates around 2% to 3.5%, while HubSpot cites email conversion rates of 2.8% for B2C brands and 2.4% for B2B brands. Mobile matters too: one roundup reports that mobile devices account for 50% to 60% of email views, with some industries reaching 81%.
For deeper benchmarks, use ClickMinded’s email marketing statistics page.
Affiliate, creator, marketplace, referral, and review stats belong here because they affect trust and repeat buying. Judge them by referral quality, conversion assist, repeat purchase rate, commission margin, review volume, rating distribution, and marketplace visibility. Use online reviews statistics when the question is about review volume, recency, ratings, fake-review risk, or reputation proof. SMS supports the same lifecycle work, but as a smaller, higher-intent owned channel with stricter consent expectations. Email, SMS, affiliates, reviews, and retention should not share one metric just because they all sit near revenue.
How to turn digital marketing statistics into budget and testing decisions
Lead quality is where channel statistics start becoming management decisions. HubSpot’s 2026 data says 77% of marketers rate their lead quality as high or very high, while 30% still list generating leads as a top challenge. That tension is useful. A team can feel good about lead quality and still have a volume, cost, handoff, or conversion problem.
CRO belongs in the same conversation as budget. HubSpot reports that Conversion Rate Optimization is the second-most-used optimization technique, used by 50% of marketers, and nearly 56% say improving conversion rates is much easier than ten years ago. The catch is measurement discipline. A higher form-fill rate can still be a bad trade if the leads never become pipeline.
For marketing statistics 2026 planning, use a simple sequence: pick the channel, match the funnel stage, verify the source year, compare the number to your internal baseline, then choose the test. For example, HubSpot’s sales conversion guidance puts typical B2B lead-to-customer conversion around 2% to 5%, with enterprise software often at 1% to 3% and professional services at 5% to 8%. A 3% rate can be strong in one segment and weak in another.
For reporting, prioritize metrics that connect activity to revenue. HubSpot says marketers’ top 2026 metrics include lead quality and MQLs at 39%, lead-to-customer conversion at 34%, ROI at 31%, CAC at 30%, and lead volume at 29%. Use ClickMinded’s marketing metrics guide for measurement definitions and the marketing benchmarks guide when you need comparison ranges. Digital marketing statistics are planning inputs, not universal targets.
Which ClickMinded stats page should you use next?
Use this page for digital marketing statistics, online marketing statistics, and channel planning data. Use the broader marketing statistics hub when the question includes offline marketing, brand, sales, product marketing, or executive market trends.
| If you need | Use this page | Best for |
|---|---|---|
| Broad marketing stats beyond digital channels | Marketing statistics | General marketing statistics 2026, trend citations, and non-digital context |
| Metric definitions | Marketing metrics | CAC, ROAS, LTV, conversion rate, MQLs, attribution, and reporting language |
| Planning ranges | Marketing benchmarks | Turning stats into targets without pretending one benchmark fits every channel |
| SEO budgets and KPIs | SEO statistics | Organic traffic, rankings, visibility, and SEO investment cases |
| Paid search and digital advertising statistics | PPC statistics | CPC, CPA, ROAS, budget splits, paid search, paid social, and performance goals |
| Social platform trends | Social media statistics | Audience behavior, organic social, paid social context, and channel mix decisions |
| Email and SMS data | Email marketing statistics | Owned audience planning, retention, segmentation, and email benchmarks. HubSpot reports an average email click-through rate of 2.5% across industries. |
| AI marketing data | AI marketing statistics | AI usage, productivity, personalization, campaign operations, and LLM visibility |
| Content performance | Content marketing statistics | Blog strategy, content ROI, traffic goals, and editorial investment |
| Video benchmarks | Video marketing statistics | YouTube, short-form video, repurposing, engagement, and production planning |
| Review and reputation data | Online reviews statistics | Review volume, rating thresholds, recency, local trust, fake-review risk, and reputation proof |
If you are building the plan first, start with the ClickMinded digital marketing strategy guide, then use the statistics page that matches the decision.
Common questions about digital marketing statistics
What are digital marketing statistics? Sourced data points about online channels like SEO, PPC, paid social, email, SMS, content, video, affiliate, reviews, CRO, and analytics.
What stats are most useful for 2026 planning? Use stats tied to decisions: budget, channel mix, ROI, traffic source, conversion rate, and retention. Forge Apollo reports that 40.65% of website traffic comes from organic search in 2026.
How are online marketing statistics different from digital advertising statistics? Online marketing includes owned, earned, and paid channels. Digital advertising usually means paid media.
What digital marketing benchmark should I use? Use channel-specific benchmarks. A blended benchmark usually muddies planning.
Where can I find 2026 channel stats? Use the ClickMinded pages above for SEO, PPC, social, email, AI, content, video, metrics, and benchmarks.