
AI marketing statistics 2026, sorted by signal quality
AI marketing statistics are messy in 2026 because the search intent is mixed. You may be looking for adoption benchmarks, ecommerce traffic trends, generative AI marketing statistics, AI marketing ROI statistics, or a sanity check before buying another tool that promises to make the content calendar behave. This guide separates the numbers by what they actually measure, so you can spot real adoption signals, vendor-survey optimism, and performance claims that need caveats.
For broader context, see our guides to marketing statistics, marketing metrics, marketing benchmarks, and digital marketing statistics. This page focuses on AI in marketing statistics, with labels for marketing-specific data, business-wide AI adoption, consumer trust, and vendor survey data.
| Statistic | Source | Year | Source type | What it indicates | Caveat |
|---|---|---|---|---|---|
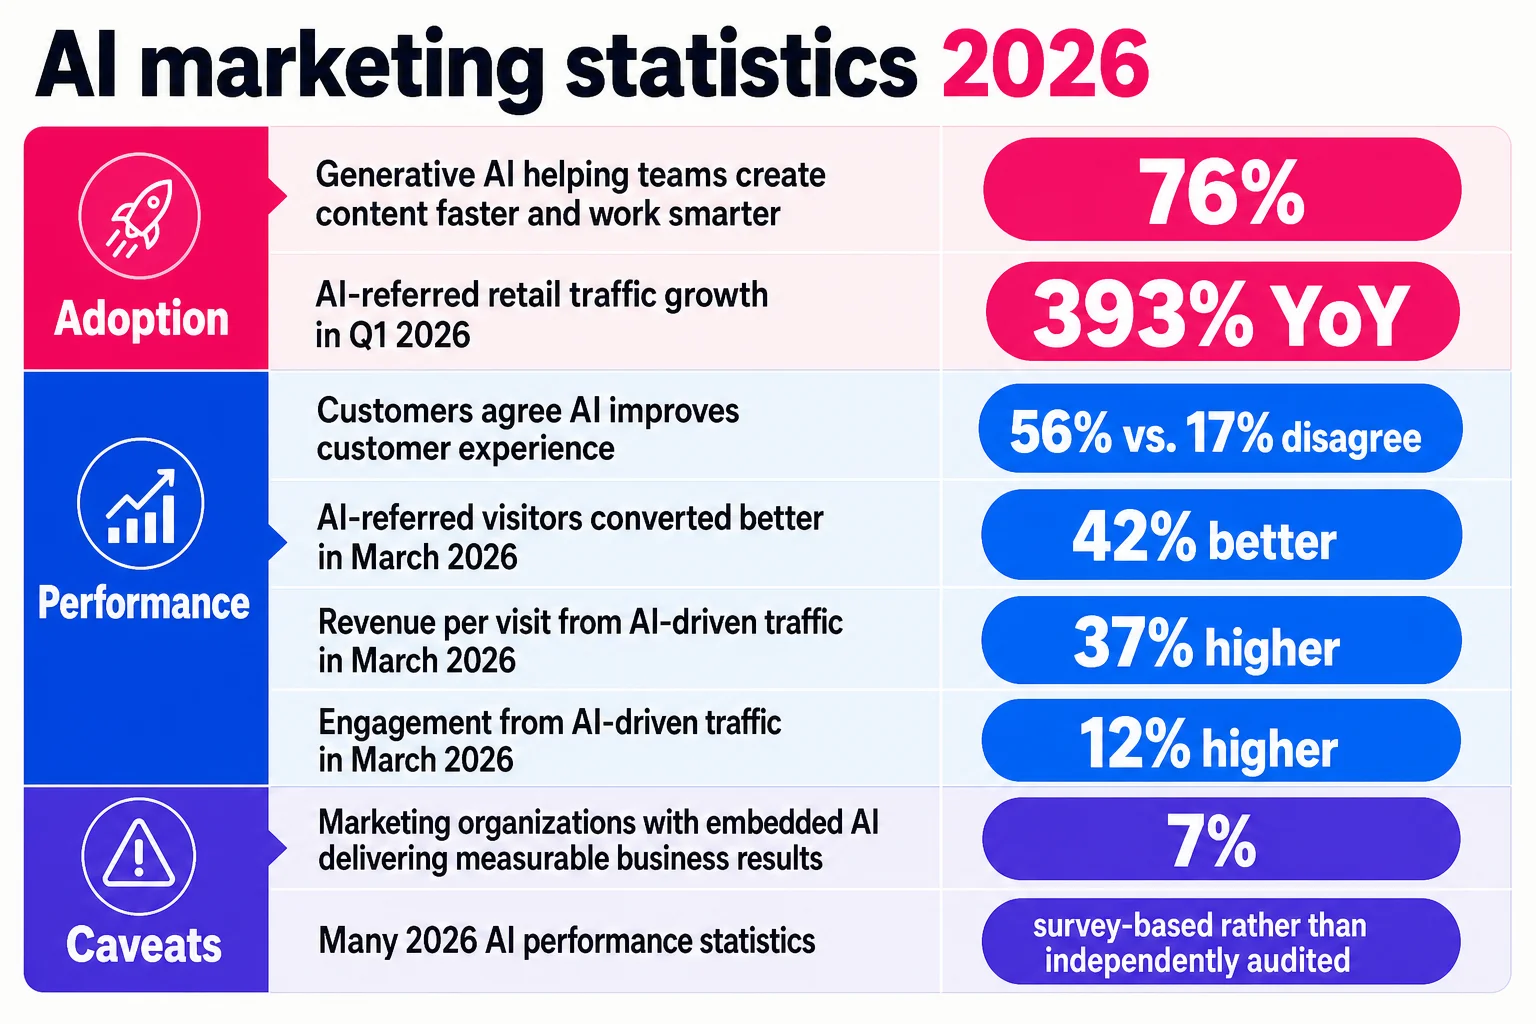
| AI-referred visitors to US retail sites converted 42% better than non-AI traffic in March 2026 | Adobe | 2026 | Retail traffic analysis | AI-sourced visits may be getting more commercially useful in ecommerce | Retail-specific, US-focused, and dependent on how AI referrals are identified |
| AI-referred retail traffic grew 393% year over year in Q1 2026 | Adobe | 2026 | Retail traffic analysis | AI search and assistant referrals are becoming a real traffic source | Traffic growth does not prove revenue lift |
| AI-driven traffic to US retail sites delivered 37% higher revenue per visit and 12% higher engagement than non-AI traffic in March 2026 | Adobe | 2026 | Retail traffic analysis | AI-referred sessions can be high-intent in retail | Correlation, not proof that AI caused better buying behavior |
| 76% of organizations report that generative AI helps teams create content faster and work smarter | Adobe | 2026 | Vendor survey data | Speed and content output are the clearest adoption signals | Self-reported, and speed does not equal quality, revenue, or profit |
| Only 7% of marketing organizations have embedded AI in ways that deliver measurable business results | Adobe | 2026 | Vendor research and commentary | Many teams are using AI before they can measure business impact cleanly | The definition of “embedded” and “measurable” matters |
| Customers are more likely to agree than disagree that AI improves their customer experience, 56% vs. 17% | Adobe | 2026 | Consumer survey data | Consumers may accept AI when it improves convenience or relevance | Trust varies by use case, data sensitivity, disclosure, and human review |
Read every AI marketing stat like a label on food packaging. The front says “high protein.” The back tells you whether that means dinner or a candy bar with ambition.
Start with the source type. Traffic analysis, platform data, audited financial results, customer surveys, and vendor surveys do different jobs. A retail traffic report can show referral behavior. A survey can show what marketers believe happened. Neither automatically proves AI caused higher ROI.
Then check the sample. “Organizations” is broader than “marketing organizations.” A retail ecommerce number is not a B2B pipeline benchmark. A consumer sentiment stat belongs in the trust bucket, not the adoption bucket. Geography and timing matter too: US retail behavior in March 2026 does not describe every market, channel, or customer journey.
Broad business AI adoption stats can still help, but label them clearly. Marketing leaders need to know whether a number reflects marketing teams, ecommerce traffic, customer experience, content operations, or general enterprise AI use.
Be careful with causality. Better conversion, higher revenue per visit, and faster content production are useful signals, but AI-referred visitors may already be higher-intent. Teams that adopt AI may also have better data, larger budgets, or stronger operations. Treat performance claims as hypotheses to test inside your own funnel.
Separate marketing adoption from broad AI adoption
Current ranking pages, including AI stat roundups from Adobe, Shopify, Salesforce, TechnologyChecker, Improvado, HubSpot, and AI SEO publishers, often place adoption numbers beside market-size forecasts as if they answer the same question. They do not. Adoption tells you who is using AI. Market size estimates tell you where vendors, buyers, and analysts expect spending to go. Neither one proves that a marketing team made more money because it added AI.
The clean split is simple:
| Stat type | Label to use | What it can tell you | What it cannot prove |
|---|---|---|---|
| Marketing team usage | Marketing-specific | Whether marketers use AI in campaigns, content, analytics, personalization, or operations | That AI improved profit, pipeline quality, or brand trust |
| Company-wide usage | Business-wide AI adoption | Whether AI is spreading across the enterprise | That marketing has adopted AI deeply |
| Platform or vendor surveys | Vendor survey data | What customers, users, or surveyed teams report doing | Independent performance impact |
| Revenue or TAM projections | Market forecast | Expected spending potential | Realized ROI for marketing teams |
Salesforce has several marketing-specific resources that track AI inside the marketing function, including its State of Marketing 2026 coverage, broader marketing statistics hub, and AI for marketing material. Treat those as marketing-specific or vendor survey data depending on the claim. That distinction matters because a CMO cares less about whether the enterprise “uses AI” somewhere in finance or IT and more about whether AI is built into segmentation, creative production, lifecycle marketing, reporting, and customer experience.

Business-wide AI adoption still belongs in the guide, but only with a warning label. It can explain why marketing teams feel pressure to test AI, why budget conversations have changed, and why vendors are adding AI to every product page with the subtlety of a marching band in a conference room. It cannot stand in for AI adoption in marketing. A company may have AI in customer support, engineering, or internal productivity tools while the marketing team is still experimenting with prompts in a shared doc.
For B2B teams, the split gets sharper. LinkedIn benchmark discussions and enterprise marketing reports often reflect sales and marketing maturity, buyer committee complexity, and content operations in larger organizations. If you are comparing AI adoption inside B2B go-to-market teams, read it beside broader B2B marketing statistics rather than generic business AI adoption data.
Market-size forecasts need the same treatment. Shopify-style ecommerce framing and marketing AI market forecasts are useful because they show where spending may move, especially in retail media, customer experience, content tooling, and automation. But a forecast is a spending signal, not a performance result. A large projected market can mean buyers are experimenting, vendors are bundling AI into existing platforms, or investors expect demand. It does not mean every team buying AI tools will see better CAC, conversion rate, retention, or marketing ROI.
IBM’s State of Salesforce 2025 analysis says enterprise AI programs still face inconsistent ROI and scaling challenges. That caveat matters for marketing leaders: early adoption can be real while measurement remains weak. The adoption curve can move faster than governance, data quality, workflow design, and attribution.
Use adoption stats to decide where AI is becoming normal. Use market-size forecasts to understand where budgets and vendor roadmaps are moving. Use your own funnel data to decide whether AI is improving marketing performance.
Where AI shows up in marketing workflows
The mature AI marketing use cases sit near existing data and repeatable work: personalization, email, recommendations, analytics, chatbots, and campaign targeting. Generative AI for copy and creative variants is moving fast, but most teams still use it for ideation, drafting, and versioning, not final brand or budget calls.
| Use case | Adoption signal | Where it fits | Watch-out |
|---|---|---|---|
| Email personalization | Marketing vendor data says 87% of organizations that adopted AI for personalization use it in email marketing, with reported 15 to 25% conversion lifts versus non-personalized campaigns. | Lifecycle, CRM, ecommerce. Better timing, offers, and variants for known audiences. | Vendor-reported lifts depend on list quality, segmentation, testing, and the control group. Tiny detail. Only the whole ballgame. |
| Customer experience personalization | Vendor survey data reports 82% use AI personalization to improve customer experience, with claimed 5 to 8x return on marketing spend, 15% higher retention, and 18 to 25% higher email engagement. | CX, ecommerce, CRM. More relevant journeys across site, email, app, and service. | Treat these as directional benchmarks. Data quality and consent rules decide how far this can go. |
| AI-targeted paid campaigns | Retail analysis says leading retailers using AI personalization see 10 to 25% increases in ROAS from AI-targeted campaigns. | Paid media, retail media, growth. Better audience selection, offer matching, and creative rotation. | Big retailers have scale, purchase data, and testing volume smaller teams may not. |
| Product recommendations and next-best-action | Salesforce describes AI personalization using browsing, purchase, and engagement data to predict actions. | Ecommerce, lifecycle, revenue operations. Product discovery and retention. | This works best with deep first-party data. |
| Chatbots and guided support | AI chatbots are used for lead qualification, FAQ responses, and support tasks. | Demand gen, CX, support marketing. Faster routing and cleaner CRM handoffs. | Bad answers damage trust fast. Escalation rules matter. |
| Generative creative variants | McKinsey notes gen AI can tailor copy, imagery, and experiences at high volume and speed. | Content, creative, lifecycle, paid media. More variants for segments, promos, and tests. | Drafting is different from autonomous publishing. Humans still own brand, legal, accuracy, and originality review. |
| Social and influencer planning | Research and industry coverage point to AI for identifying influencers and predicting post performance. | Social, influencer, PR. Shortlist building and performance forecasting. | Evidence is thinner. Use AI for screening before committing budget. |
Teams are most comfortable where the workflow already has structured data and measurable actions. Popularity does not prove a use case works everywhere. Ideation, drafting, scoring, and recommendations are safer starting points. Autonomous decisions about spend, targeting, pricing, and customer treatment need stronger controls, cleaner measurement, and governance before they leave the sandbox.
Content and SEO are where generative AI use gets messy fast
Generative AI shows up in the marketing work teams already wanted to speed up: brainstorming, briefs, outlines, first drafts, ad variants, meta descriptions, landing page copy, email copy, product descriptions, social posts, and repurposing.
The clean version is that AI helps teams make more assets faster. The messier version is that more assets can also mean more review work, repeated ideas, shaky claims, and pages that never earn traffic. For the non-AI baseline, compare this with our broader content marketing statistics and SEO statistics.
| Area | Current signal | How to read it |
|---|---|---|
| AI SEO investment | In 2026, 98% of marketers plan to increase investment in AI for SEO, and 61% are increasing overall SEO budgets. | Budget intent does not prove AI SEO work will rank, convert, or lower acquisition costs. |
| Content ideation | 45% of marketers use AI to brainstorm content ideas. | Low-risk entry point. The quality gap appears when everyone publishes the same obvious angles. |
| Repetitive content tasks | 43% of marketers use AI to automate repetitive tasks. | Good fit for summaries, variants, formatting, tagging, and repurposing. Risk rises around factual claims or regulated topics. |
| Blog creation | Typeface reports that marketers who do not use AI for blog creation fell from 65% to 5% over two years. | Treat this as vendor survey data. It suggests mainstream use, but sample details matter. |
| GenAI marketing adoption | EDHEC reports 75% of marketing departments use GenAI, with 10% fully implemented and 65% experimenting. | Most teams are still testing. Experimenting is not the same as having a governed publishing system. |
| Legal and IP concern | Deloitte Digital reports 65% of companies are very or extremely concerned about intellectual property or legal risks when using generative AI for marketing content. | Content teams cannot prompt their way out of rights, claims, or compliance problems. |

For SEO, the useful AI workflows are usually boring in the best possible way: clustering keywords, summarizing SERP patterns, drafting title tag options, building briefs, finding internal link opportunities, rewriting stale sections, and turning webinars into article outlines. AI helps most when the team already understands search intent, audience, and editorial standards.
Creative teams can also get real value from faster variants. AI can produce ten ad hooks, five subject line angles, three landing page hero options, and a stack of social snippets before the second coffee. Great for testing. Still not a guarantee that the winner is accurate, original, compliant, or on-brand.
A practical generative AI content workflow needs checkpoints: fact-check claims, add source attribution where readers need proof, review for structure and search intent, run legal checks on rights and regulated language, and test brand voice manually. Then measure what happens after publishing: rankings, impressions, clicks, assisted conversions, leads, pipeline, and content decay. Output volume is a production metric. Organic traffic, qualified leads, revenue influence, and retention are business metrics.
Productivity stats measure time saved before they measure money saved
AI productivity numbers usually measure hours, speed, or perceived output. They are weaker evidence for profit unless the study also tracks costs, quality, and what the team did with the time.
Marketing survey data points the same way: AI often saves time. HubSpot AI Trends 2026 data cited by Digital Applied says marketers save an average of 6.1 hours per week, with senior practitioners saving 8 to 10 hours and junior staff saving 3 to 4 hours. Adobe reports that marketers using AI are 44% more productive and save 11 hours per week, useful vendor survey data, but still worth checking against your own workflow. Sopro reports that 83% of marketers say AI increased productivity and 84% say it improved delivery speed.
Separate three things before calling that money saved: perceived time savings, measured cycle-time reduction, and financial cost reduction. A marketer saying “this saved me six hours” is not the same as a project moving from ten business days to six. A faster project is not the same as lower cost if the team adds review steps, buys more tools, or spends the saved time on extra output that never ships.
Use this model before treating AI as a cost saver:
Gross time saved minus review time, rework, tool cost, training, governance, and measurement overhead.
Broader workforce data is more restrained. One analysis reports that workers using generative AI save 5.4% of weekly work hours, about 2.2 hours, but the average drops to 1.1% to 1.4% across all workers. The same source cites a study of 6,000 executives where 89% to 95% of firms reported no measurable bottom-line impact. Time savings are real, but finance teams need proof that the time became lower cost, more capacity, or better outcomes.
AI personalization and campaign optimization stats need cleaner proof
Performance AI is where marketers want clean numbers and often get messy ones. Personalization, customer experience, paid media, attribution, and analytics all sit close to revenue, which makes every vendor chart tempting. Treat those claims as directional unless they show the baseline, audience, time period, channel mix, and measurement method.
AI personalization is usually framed around better recommendations, timing, content, and customer journey decisions. That framing is well supported by practitioner sources, which describe AI-powered personalization as a way to tailor content, offers, and CX flows based on behavior, context, and predicted intent in customer experience programs, commerce personalization, and marketing operations.
The caveat: many personalization pages are vendor explainers, not neutral benchmarks. Contentful’s personalization statistics collection is useful for building a quick evidence list, but teams should trace each number back to its original study before using it in a budget deck. A stat about consumers preferring relevant experiences is not the same as a stat proving profit lift from an AI model.
McKinsey’s discussion of gen AI personalization is better read as strategic guidance than as a numeric benchmark. It points to more precise targeting, content assembly, and operating model changes, but it does not remove the measurement work.
Paid media has the same problem with shinier buttons. AI often shows up as automated bidding, audience expansion, creative variation, budget pacing, anomaly detection, and reporting summaries. These features may support performance when teams have enough conversion data and a clear feedback loop. They do not prove incremental ROI by themselves.
Attribution is the danger zone. Platform reports can over-credit their own campaigns, last-click models can hide assisted demand, and black-box optimization can make it hard to explain why spend moved. Judge AI media tools against incrementality, CAC, ROAS, LTV, pipeline quality, and measurement quality, not just platform-reported conversions. For a deeper measurement checklist, use the broader guide to marketing metrics.
A useful stats table should label each claim as personalization preference, CX improvement, platform-reported performance, or incrementality-tested lift. The fourth is strongest. The first three can help with planning, but they do not prove AI caused profitable growth.
AI marketing trust stats belong in the risk plan
Trust stats are consumer trust stats, not marketer adoption stats. Keep the label on them, because a team can be excited about AI while customers are still worried about what happens to their data.
Only 40% of consumers say they trust brands to keep personal data secure and use it responsibly. The same privacy and brand trust data says 83% of consumers are concerned about sharing personal data online, and 72% would stop buying from a company or using a service because of privacy concerns. Another privacy roundup reports that 75% of consumers will not purchase from organizations they do not trust with their personal data.
AI makes that concern sharper because recommendations, chat support, segmentation, and personalization all depend on customer data. CDP.com reports that 81% of people have privacy concerns over how AI is used for recommendations, customer service, and support. Treat that as consumer sentiment, not proof that AI personalization fails. It means marketers need clearer consent, better explanations, and tighter data rules before scaling customer-facing AI.

The internal risk data points the same way. In AI governance research, 34% of organizations cite employees inputting sensitive data into AI systems as the top employee risk concern, and 21% say insufficient training drives most risky behavior. If the team is pasting customer records, unreleased campaign plans, contracts, or sales notes into unapproved tools, the AI program has a governance problem with a productivity costume on.
A practical AI marketing governance checklist should include approved tools, data handling rules, human review for public outputs, disclosure policies for AI-assisted content or chat, output logging, brand and legal review for high-risk uses, and vendor risk assessment. Privacy guidance around AI data privacy concerns and responsible AI privacy practices also points to explicit consent, transparency, model documentation, vendor controls, and human oversight.
There is a business case, too. Marketers in a 2022 consent and preferences report estimated that every $1 invested in consent and preference management returned $38 in ROI, with a 10% increase in lifetime customer value and a 5% decrease in customer acquisition cost. Read that as vendor survey data, not a universal ROI promise. AI marketing readiness includes consent, privacy, review, and accountability before scale.
Measure AI marketing ROI with lift, controls, and boring definitions
Treat AI marketing ROI stats as four buckets: reported ROI, perceived impact, modeled impact, and measured incremental lift. Reported numbers get loud, like the claim that 88% of daily AI users report an average ROI of 300%, while content creation tools average 420% ROI. Modeled impact is different, like the estimate that generative AI in marketing and sales could add about $463 billion in annual value, with productivity gains equal to 5% to 15% of total marketing spend. Neither proves your next campaign will make money.
Use holdouts, geo tests, time-based tests, or controlled before/after analysis. This matters because only 14% of organizations track AI content performance versus human content as a KPI.
| Workflow | Primary metric | Guardrail | Test |
|---|---|---|---|
| Content | Revenue/session | Accuracy | Controlled before/after |
| Incremental revenue | Unsubscribes | Holdout | |
| Paid media | CAC or ROAS | Margin | Geo test |
| Sales enablement | Pipeline | Win rate | Rep split |
| Personalization | Conversion lift | Privacy complaints | A/B test |
FAQ, minus the fog machine: the AI marketing stats that matter most are adoption, use case, productivity, trust, and measured ROI. “How many marketers use AI?” depends on whether “use” means daily workflow or one weird afternoon with a chatbot. Reported ROI can be high, but measured ROI needs incrementality. The common use cases are content drafts, SEO briefs, creative variants, email, personalization, research, and analytics support. The risks are privacy, weak governance, inaccurate output, brand drift, copyright risk, and overcounted attribution.