
Email marketing conversion rate formulas for clean reporting
Email marketing conversion rate is the percentage of people who complete a defined conversion after receiving, opening, clicking, or landing from an email. Pick the denominator that matches the question you are answering.
| Reporting question | Best formula | Use when | Watch out for |
|---|---|---|---|
| How many delivered emails produced the action? | Conversions / delivered emails x 100 | Campaign efficiency. Bloomreach uses conversions divided by delivered emails. | This looks lower because it includes people who never clicked. |
| How well did clicks turn into outcomes? | Conversions / unique email clicks x 100 | Measuring click-to-conversion rate. | Do not compare it with delivered-email benchmarks. |
| How well did the landing page convert email traffic? | Conversions / email landing sessions x 100 | Diagnosing the page, form, or checkout. | UTMs, consent settings, sessions, and cross-device behavior can change the count. |
| How many recipients bought? | Orders / delivered emails x 100 | Ecommerce promos, launches, and lifecycle emails. | Separate campaigns from flows. Klaviyo reports 0.16% average placed order rate for campaigns and 2.11% for automated flows. |
| How many recipients became leads? | Leads / delivered emails x 100 | B2B, SaaS, webinars, demos, trials, and content offers. | Define “lead” before reporting. MQL, demo request, and trial are different conversions. |
| How much money did each recipient produce? | Attributed revenue / delivered emails or recipients | Revenue-per-email reporting. | Attribution windows can inflate or undercount revenue. Klaviyo reports $0.32 for campaigns and $2.54 for flows. |
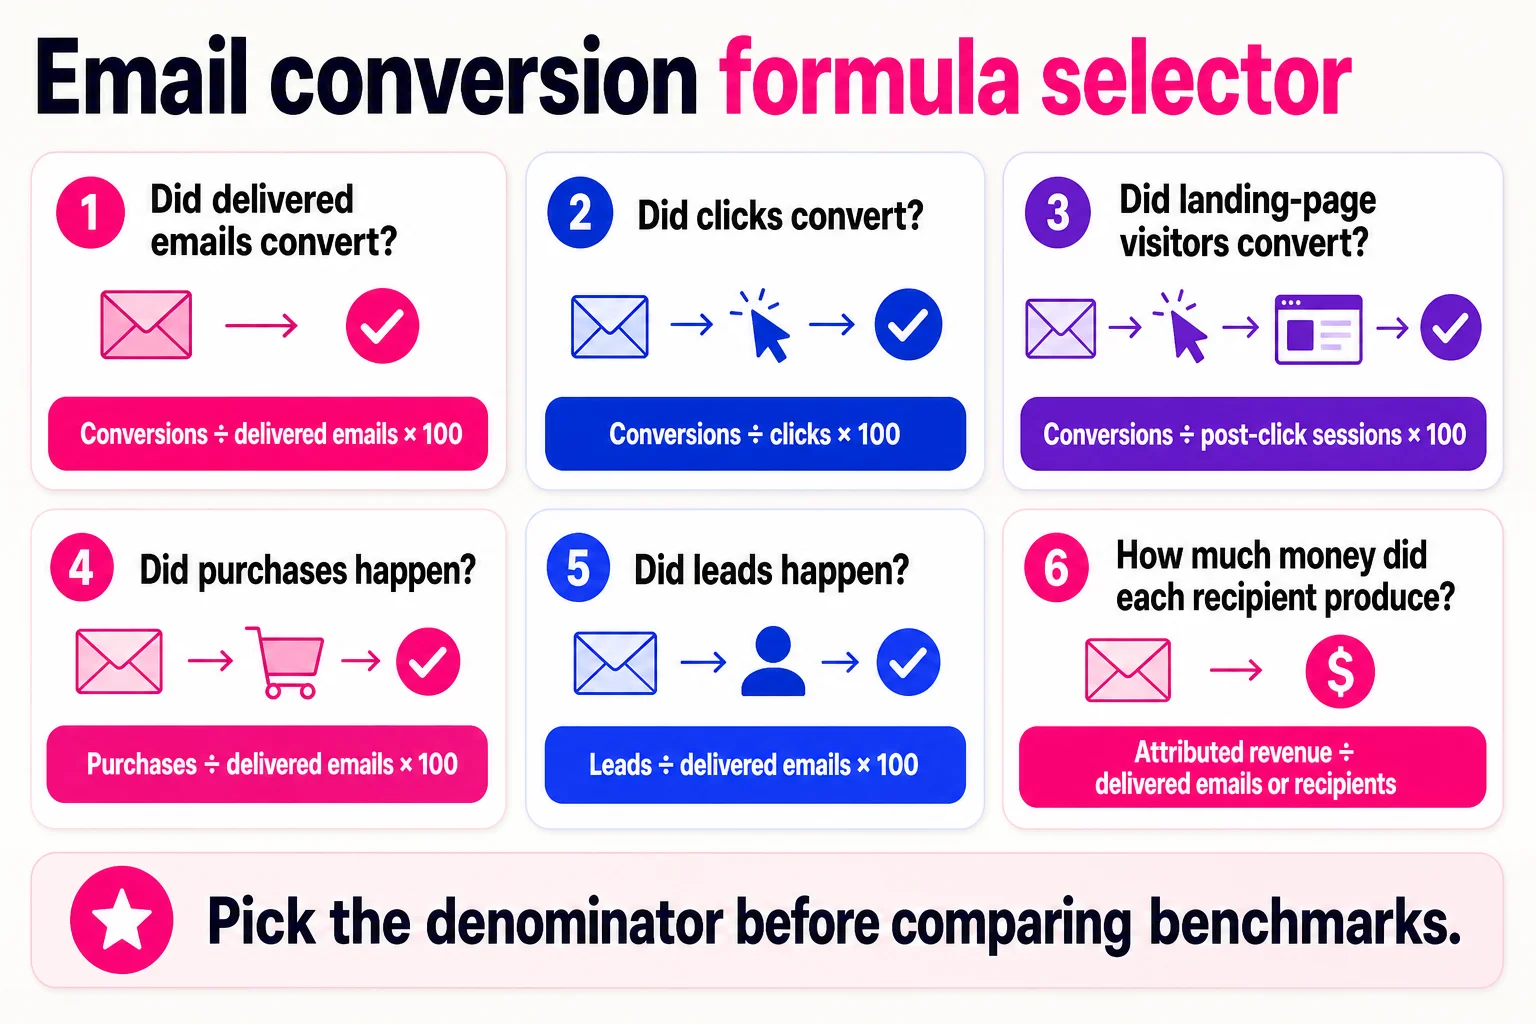
A broad 2% to 5% benchmark only helps after you define the conversion and denominator. Open-based reporting is weaker now because Apple Mail Privacy Protection can register opens even when someone has not viewed the message, as Brevo notes in its email benchmark methodology guidance.
Email conversion rate changes when the conversion changes
An email conversion rate only means something after you name the action. ActiveCampaign defines it as the percentage of recipients who complete a desired action after clicking through an email, such as a purchase, demo booking, or form submission. That definition is useful, but it is also where reporting starts to get messy.
Opens and clicks have relatively consistent meanings. A click is a click, which is why benchmarks for a good email click rate or an average email click rate are easier to compare across sources. Conversions are different. For ecommerce, the conversion may be a purchase. For SaaS, it may be a trial signup, demo request, activation event, webinar registration, or upgrade.
That is why clean reporting separates ecommerce, lead gen, and lifecycle flow definitions before anyone quotes a benchmark. A 3% purchase rate, a 3% demo-request rate, and a 3% post-click landing page rate describe different business outcomes, even if the spreadsheet labels them all “email conversion rate.”
Pick the email conversion rate formula by the question you need to answer
The right formula depends on what you want the number to diagnose. Use the denominator as the filter. Delivered-email conversion rate is usually best for judging email performance. Click-to-conversion rate is better for offer and landing-page quality. Revenue per delivered email or recipient is better for ecommerce and lifecycle analysis.
| Business question | Formula | Use this when |
|---|---|---|
| How many delivered emails produced the action? | Conversions / delivered emails x 100 | You want the cleanest read after bounces are removed. |
| How did the full send perform, including bounces? | Conversions / sent emails x 100 | You are reporting list-level performance and deliverability is part of the story. |
| Did clickers convert after showing intent? | Conversions / unique clicks x 100 | You want to isolate the offer, page, checkout, or form after the click. |
| Did email traffic convert on the site? | Conversions / landing page sessions x 100 | You are comparing email traffic against page performance. Pair this with landing page statistics and a landing page conversion benchmark. |
| How many delivered emails became purchases? | Purchases / delivered emails x 100 | You are measuring ecommerce purchase conversion from a send or flow. |
| How many delivered emails became leads? | Leads / delivered emails x 100 | You are measuring demo requests, trials, webinars, or form fills. |
| How much money did email generate per recipient? | Revenue / delivered emails or revenue / recipients | You care about ecommerce, retention, lifecycle flows, and list monetization. |
For client or leadership reporting, name the denominator in the chart title. “Email conversion rate” is too easy to misread. “Purchase conversion rate from delivered emails” survives the meeting.
Average email marketing conversion rate benchmarks are messy
There is no universal average email conversion rate worth copying into a dashboard. A benchmark might mean purchase rate, form-fill rate, click-to-conversion rate, or attributed revenue rate. Opens and clicks are easier to compare because they happen inside the email system. Conversions happen after the click, so the number changes with the offer, site, attribution window, and business model.
| Source type | Best use | Bad use |
|---|---|---|
| MailerLite-style conversion guidance | Formula discipline and reporting language for a defined action | Universal industry average |
| Klaviyo ecommerce benchmarks | Purchase and revenue comparison for ecommerce brands in that platform dataset | B2B lead gen, publisher email, or non-Klaviyo tracking |
| Mailchimp industry benchmarks | Open and click context by industry | Purchase or lead quality after the click |
| Bloomreach commerce framing | Ecommerce conversion definitions and optimization | Neutral average across all email programs |
| Unbounce landing-page context | Diagnosing post-click offer and page performance | Delivered-email conversion without matching platform data |
Use ClickMinded’s email marketing benchmarks and email marketing statistics pages for broader context, then label the source in your report. “Klaviyo ecommerce purchase conversion” and “MailerLite-style defined action conversion” are different comparisons, even when both get called email conversion rate.
Report campaigns and automations in separate views
A newsletter and an abandoned-cart flow can both have an email campaign conversion rate, but they should not share a benchmark row. Campaigns reach a broad audience at a chosen send time. Triggered flows fire after behavior, like signup, cart activity, or product browsing. They convert differently because intent and timing are different, not because the copywriter found a secret keyboard shortcut.
Report campaigns, automations, and lifecycle stages separately. Compare each email against peers with the same job.
| Email type | Primary conversion | Recommended denominator | Benchmark against | Common mistake |
|---|---|---|---|---|
| One-off campaign | Sale, signup, registration, reply | Delivered emails or clicks | Similar campaigns | Comparing to cart flows |
| Triggered automation | Purchase or next-step action | Triggered recipients or clicks | Same flow type | Mixing all automations |
| Lifecycle sequence | Stage progression | Enrolled contacts | Same lifecycle stage | Treating it like one blast |
Match the benchmark to the conversion type
Ecommerce and lead gen teams should not share one email conversion benchmark unless they mean the same action. Orders, qualified demo requests, trial starts, and form fills are different scoreboards.
| Reporting lens | Conversion counted | Best denominator |
|---|---|---|
| Purchase conversion | Completed order | Delivered emails or clicks |
| Lead conversion | Form fill, MQL, signup | Delivered emails or clicks |
| Trial or demo conversion | Trial start or demo request | Delivered emails or clicks |
| Post-click conversion | Landing page action | Email clicks or page sessions |
| Revenue attribution | Revenue credited to email | Recipients, delivered emails, or buyers |
Attribution can change the number even when behavior does not. A 24-hour click window, 7-day click window, last-click model, and multi-touch model can all credit email differently.
For post-click analysis, pair email reporting with landing page conversion benchmarks and conversion rate optimization statistics so a weak page does not get mislabeled as an email problem.
Improve the bottleneck you are actually measuring
If delivered-to-open is weak, fix audience fit, list source, segmentation, and sender promise before touching the offer. If click rate is weak, tighten message-market match, CTA clarity, and the gap between subject line and email body. Use good email click rate as the diagnostic, not purchase rate.

If post-click conversion is weak, keep the email mostly intact and work on landing page continuity, form friction, proof, speed, and offer clarity. Pair this with conversion rate optimization statistics.
If purchase or lead quality is weak, review offer fit and automation timing. If attribution looks strange, audit UTMs, conversion windows, exclusions, and campaign versus flow reporting inside your email marketing metrics dashboard.
FAQ: Email marketing conversion rate
What is the formula? Conversions / chosen email audience x 100.
What counts as a good email conversion rate? It depends on the action, purchase, demo, trial, signup, or booked call, and the denominator. Use benchmarks only when the model matches, such as ecommerce data from Klaviyo or broader tables from Mailchimp.
Should I divide by sent, delivered, opened, or clicked? Use delivered for list-level reporting, clicked for post-click performance, and sessions for landing page analysis.
Why is my rate lower than benchmark pages? You may be comparing a one-off campaign with automated flows, or purchase conversion with lead conversion.
Before reporting, check the conversion action, denominator, campaign type, business model, attribution window, and benchmark source.