
Email marketing benchmarks: what counts as healthy?
Email marketing benchmarks are useful only when they match the metric definition, list type, campaign type, audience intent, industry, and business model you are measuring. A welcome flow for recent ecommerce subscribers should beat a broad promotional blast. A B2B nurture email to demo-request leads should beat a cold newsletter sent to a stale list. Mash those into one “average email benchmark” and the report becomes less useful than it looks.
ClickMinded is compiling and interpreting third-party benchmark data here. We do not own the benchmark datasets. Use this as a source-aware guide, the same way our broader marketing benchmarks hub treats benchmarks as planning inputs rather than universal scorecards. For the quick-answer companions, use good email open rate, average email open rate, good email click rate, average email click rate, and email marketing conversion rate.
| Metric | Useful baseline | Best comparison set | Caveat |
|---|---|---|---|
| Open rate | Directional engagement signal | Industry and region reports from ESPs such as Dotdigital, plus “reliable opens” where available | Apple Mail Privacy Protection makes opens shaky. Litmus reported MPP accounted for 55% of all email opens as of March 2024. |
| Click rate | Stronger engagement benchmark | Platform send data with the same CTR definition, split by industry and campaign type | Bot clicks can inflate results. Klaviyo says its reporting excludes bot clicks. |
| Click-to-open rate | Message relevance among measured openers | ESP reports with clear CTOR formulas | MPP can distort the denominator when Apple Mail dominates the audience. |
| Conversion rate | Business-action benchmark | Ecommerce ESPs, CRM data, or analytics by campaign type | Purchases, demo requests, trials, and downloads are different outcomes. Keep them separate. |
| Unsubscribe rate | List-fit and frequency signal | List-health benchmarks from live send data, such as Dotdigital’s Americas benchmark edition | Higher unsubscribes can be normal after aggressive acquisition, reactivation, or a content shift. |
| Bounce rate | List quality warning | ESP deliverability reporting by region and industry | Hard bounces and soft bounces mean different things. Match the definition. |
| Deliverability | Inbox health benchmark | Deliverability tools, ESP reporting, and mailbox-provider guidance | Delivery rate is not inbox placement. “Sent” is not “seen.” |
| Revenue per recipient | Ecommerce performance benchmark | Ecommerce ESPs with order attribution | Attribution windows, discounts, repeat purchases, and product price change the number fast. |
| ROI | Channel planning benchmark | Finance-backed reporting with platform, creative, discount, and fulfillment costs | Public ROI stats are directional unless the cost model matches yours. |
The first practical rule is to stop asking whether your open rate is “good” by itself. Apple Mail Privacy Protection can preload tracking pixels through proxy servers, making emails appear opened even when a person did not read them. Postmark also notes that open time, location, and device data become unreliable for Apple Mail users because the “open” may happen on Apple’s servers.
Keep open rate on the dashboard. Just stop letting it drive decisions by itself. For planning, clicks, conversions, revenue per recipient, unsubscribes, bounce rate, and deliverability usually tell you more about whether the email program is healthy.
Different benchmark reports use different comparison groups
Email benchmark reports disagree because they are measuring different pools of email, then packaging those pools under the same friendly word: “average.” That word needs context before it becomes useful.
Cohort is the first split. Mailchimp says its campaign benchmarking uses data from hundreds of millions of emails and compares users against peers with shared industry and audience characteristics. That is useful if your list and sending behavior look like that peer group. It is weaker if you are comparing a small, high-intent sales nurture sequence against a broad marketing database.
Industry changes the answer quickly. Mailchimp reports Business and Finance at 31.35% average open rate, 2.78% click rate, and 0.15% unsubscribe rate, while Ecommerce shows 29.81% average open rate, 1.74% click rate, and 0.19% unsubscribe rate. Those are close enough to tempt overbroad comparisons, but the buying cycle, list source, email frequency, and intent behind the signup can be completely different.
Channel and campaign type create another split. A Klaviyo ecommerce flow benchmark should not be blindly applied to a B2B newsletter. A cart abandonment email sent minutes after a shopper leaves checkout has much warmer intent than a monthly thought leadership email sent to a mixed list of customers, prospects, and low-intent subscribers. A broad Mailchimp average should not be treated as a lifecycle revenue target either, because revenue per recipient depends on ecommerce tracking, attribution windows, product price, discounting, and repeat purchase behavior.
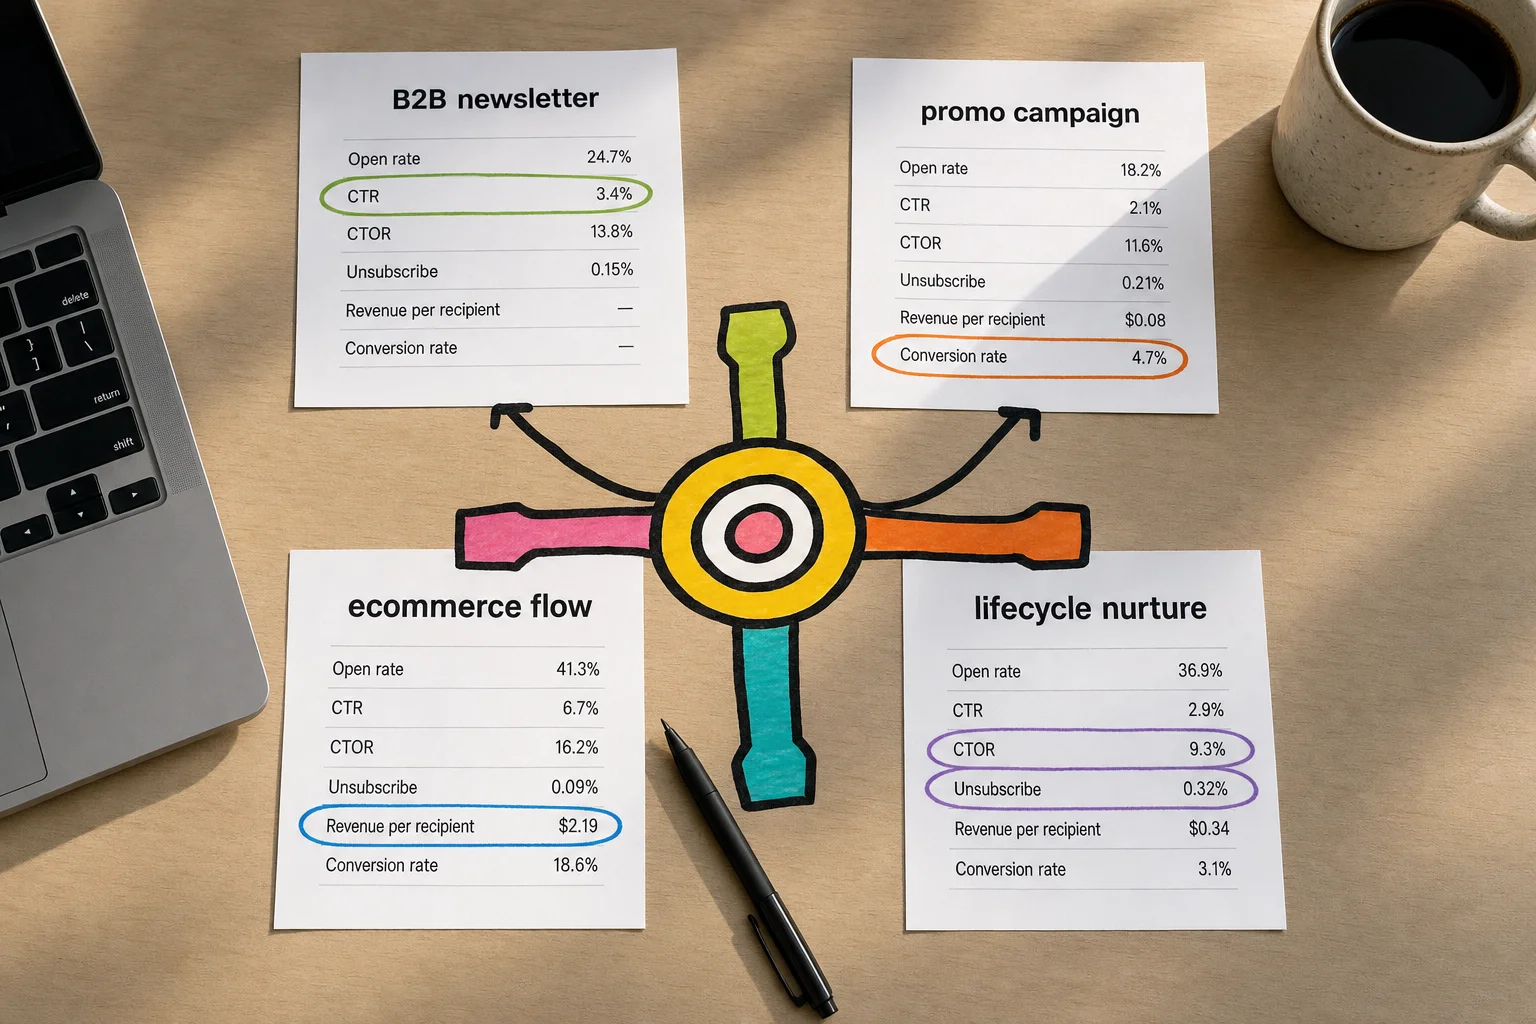
Metric definition is the quiet troublemaker. Campaign Monitor’s 2022 report analyzed over 100 billion emails sent in 2021 and listed an all-industry average of 21.5% open rate, 2.3% CTR, 10.5% CTOR, and 0.1% unsubscribe rate. Those numbers are useful, but only after you confirm whether your reporting tool calculates rates from sent, delivered, unique opens, total clicks, filtered clicks, or another denominator.
This is why our broader marketing statistics guidance treats every public number as a starting point. The useful question is which dataset best matches your cohort, channel, industry, audience intent, and metric definition.
Define the metric before you compare the benchmark
Many email benchmark gaps are really formula gaps. Before you compare your dashboard to a public report, check the numerator, denominator, attribution window, and whether the metric counts unique people or total events. For a broader KPI refresher, keep the ClickMinded guide to marketing metrics open in the next tab.
| Metric | Common definition | Comparison trap |
|---|---|---|
| Open rate | Unique opens divided by delivered emails. Mailchimp defines open rate as the percentage of successfully delivered emails opened at least once. Klaviyo defines Opened (%) as unique opens divided by deliveries. | Open tracking got messier after privacy changes. Apple Mail Privacy Protection can preload email content and tracking pixels through a proxy, so an open may mean a pixel loaded, not that a human read the email. Use opens for direction inside the same tool, but give more planning weight to clicks, conversions, revenue, unsubscribes, bounces, and deliverability. |
| Click rate | Unique clicks divided by delivered emails. Mailchimp says click rate shows how many delivered emails registered at least one click. Klaviyo defines Clicked (%) as unique clicks divided by deliveries. | Some reports call this CTR. Others use “click-through rate” for CTOR. Compare the wrong one and you create a false performance gap. |
| Click-to-open rate | Unique clicks divided by unique opens. Klaviyo defines click-through rate as the percentage of people who clicked out of the people who opened the message. | CTOR inherits open-rate distortion. If opens are inflated, CTOR can look artificially weak. |
| Conversion rate | Conversions divided by recipients, delivered emails, clicks, sessions, or opens, depending on the tool. Klaviyo’s placed order rate is best treated as an attributed order conversion rate per recipient within its attribution window. | A “conversion” can mean a purchase, demo request, signup, booked call, or lead status change. Match the event and denominator before comparing. |
| Unsubscribe rate | Unsubscribes divided by delivered emails. Mailchimp reports unsubscribe rate against emails delivered. | A low rate is not always good if disengaged people stay silent and drag down engagement. |
| Bounce rate | Bounces divided by total sent. Mailchimp excludes bounced emails from open and click denominators, while bounce rate is tied to sent volume in reporting. | Sent-based and delivered-based formulas will not match. Review hard bounces and soft bounces separately. |
| Deliverability | Delivery rate measures whether mail was accepted. Inbox placement measures whether delivered mail reached the inbox rather than spam. Litmus defines inbox placement rate as the share of delivered emails that reach the inbox instead of spam. | ”Delivered” does not mean “seen.” A campaign can have a healthy delivery rate and still have an inbox placement problem. |
| Revenue per recipient | Revenue attributed to a campaign or flow divided by recipients. Klaviyo frames revenue per recipient as average revenue generated per person reached during the attribution window. | RPR depends on attribution rules, product price, discounts, repeat purchase behavior, and whether the email is a campaign or automated flow. |
| ROI | Net return divided by cost, often expressed as revenue or profit returned per dollar spent. | Email ROI can look inflated when teams count revenue but omit creative, platform, agency, discount, and margin costs. |
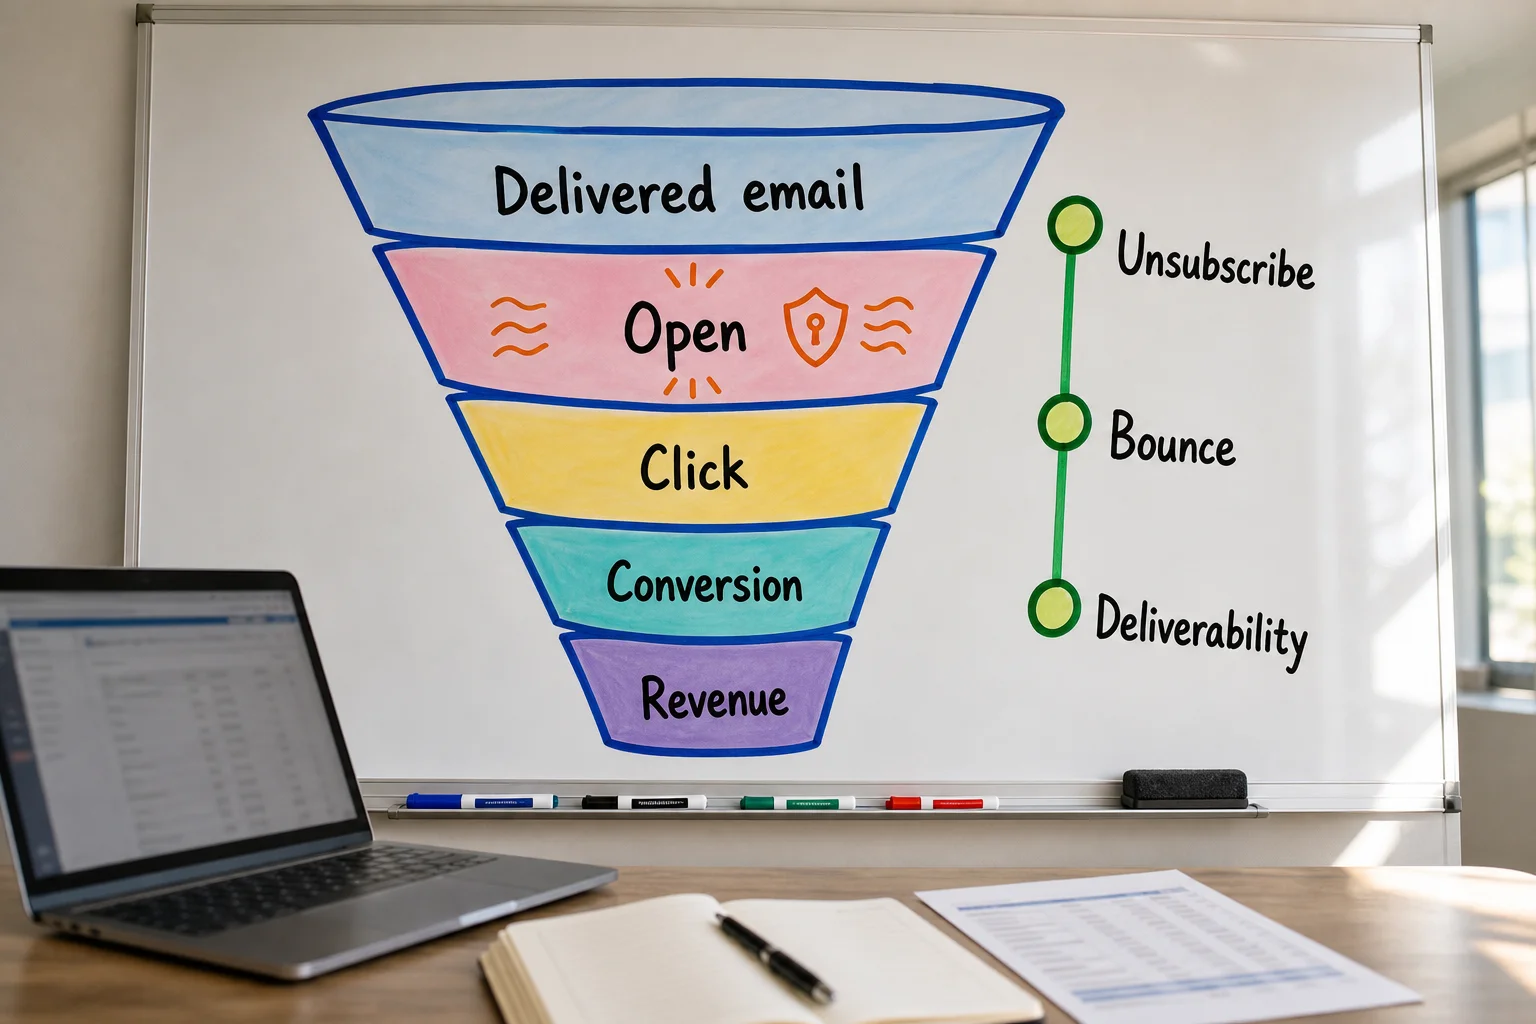
Compare delivered-based rates to delivered-based benchmarks, sent-based rates to sent-based benchmarks, unique-event metrics to unique-event metrics, and ecommerce attribution metrics to sources with similar attribution windows. If your tool changed, your benchmarks may need a reset even if the audience did not.
Match the benchmark to the audience, list, and campaign type
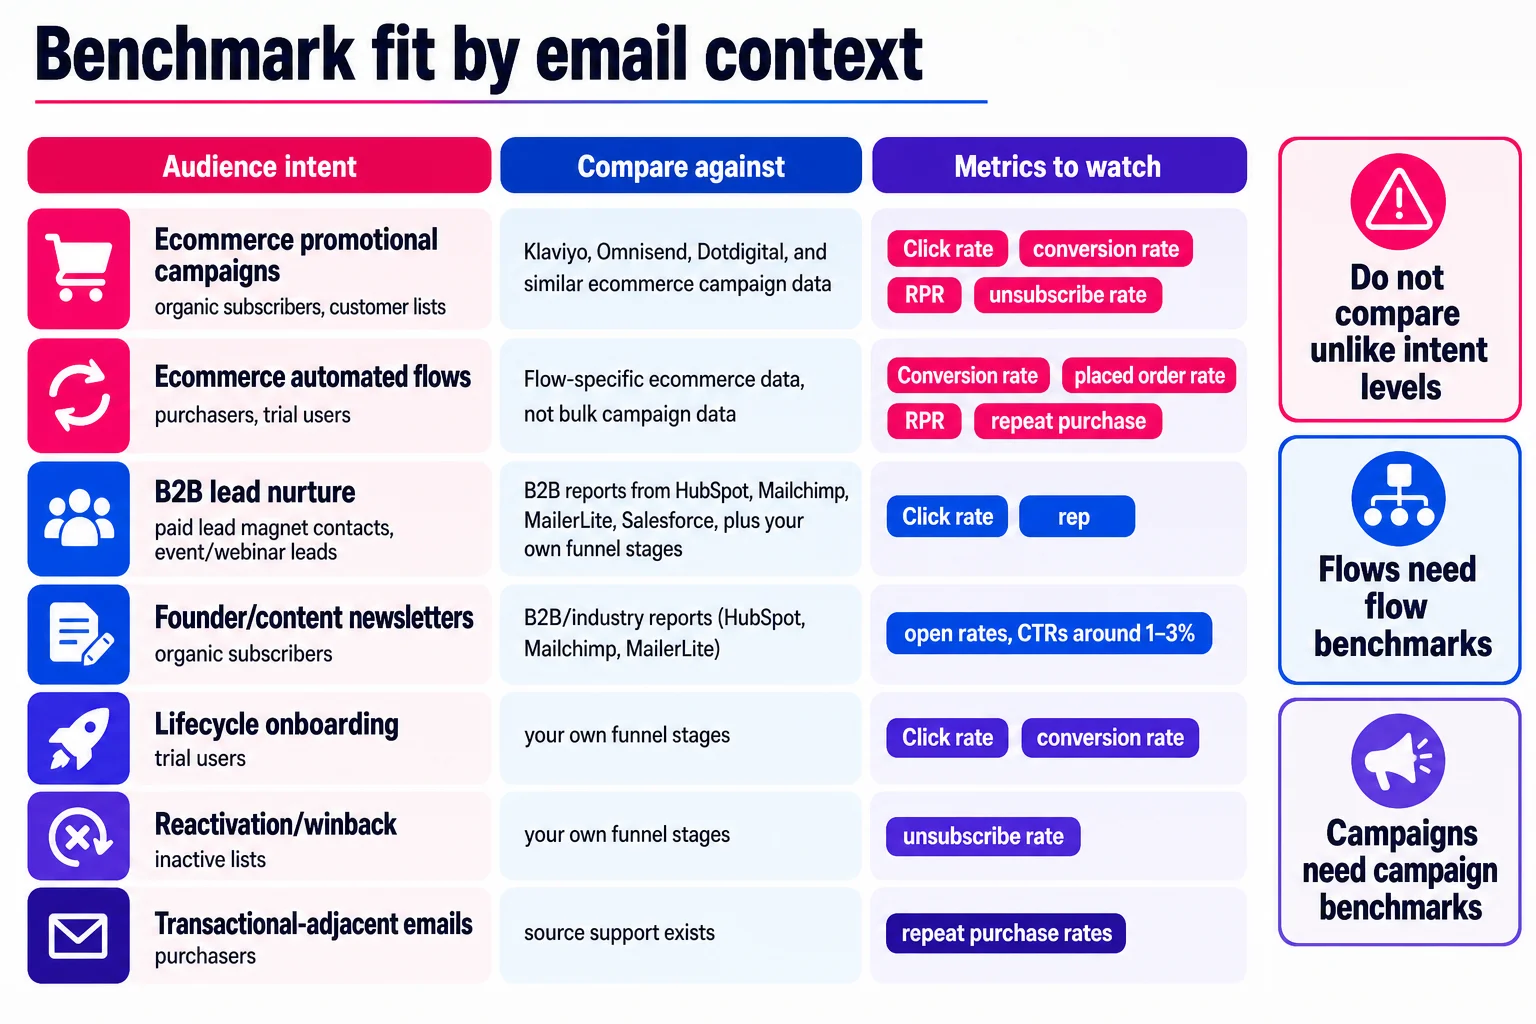
Your best comparison set has the same intent level. A purchaser getting a cross-sell, a trial user getting onboarding, and a paid lead magnet contact getting a webinar invite all technically live in “email,” but they are barely the same channel in practice.
| Email context | Compare against | Metrics to watch |
|---|---|---|
| Ecommerce promotional campaigns | Klaviyo, Omnisend, Dotdigital, and similar ecommerce campaign data | Click rate, conversion rate, RPR, unsubscribe rate |
| Ecommerce automated flows | Flow-specific ecommerce data, not bulk campaign data | Conversion rate, placed order rate, RPR, repeat purchase |
| B2B lead nurture | B2B reports from HubSpot, Mailchimp, MailerLite, Salesforce, plus your own funnel stages | Click rate, replies, meeting conversion, unsubscribes, stage movement |
| Founder or content newsletters | Newsletter reports and your own cohort history | Click rate, replies, shares, sponsor clicks, list growth |
| Lifecycle onboarding | SaaS, lifecycle, and CRM data that separates onboarding from bulk sends | Activation, feature adoption, clicks, churn signals |
| Reactivation and winback | Your own history first, because inactive cohorts behave differently from active subscribers | Reactivation, conversion, spam complaints, unsubscribes, bounces |
| Transactional-adjacent emails | Internal benchmarks and platform reporting | Delivery, service-link clicks, support deflection, repeat purchase where allowed |
The automation gap shows why context matters. Klaviyo reports a 5.58% average click rate for flows vs. 1.69% for campaigns, and its abandoned-cart report shows about a 3.33% placed order rate and $3.65 RPR. Omnisend’s 2025 ecommerce data says automated emails produced $3.41 revenue per email vs. $0.155 for campaign emails, with a 1.49% conversion rate vs. 0.08% for campaigns.
That does not mean every brand should fire off more automations like a caffeinated Roomba. It means triggered intent usually beats calendar-based sending when the trigger is real.
Source quality changes the benchmark before the subject line exists. Organic subscribers and customers usually start warmer than paid giveaway leads. Webinar leads may click educational content but ignore product offers. Purchasers may convert again with less friction. Inactive lists can make every metric look broken at once. Segment those cohorts before judging the campaign.
Metric-by-metric guidance: what to trust, what to question
Open rate: Use it for subject-line direction and rough list engagement, not clean proof of human attention. Mailchimp reports a 35.63% all-user open rate, while Klaviyo reports a 31% average campaign open rate, but Apple Mail Privacy Protection muddies the water. If opens sag, check deliverability, list age, sender name, subject line, and whether your source filters privacy opens.
Click rate: Use it for offer and content relevance. Klaviyo reports 1.69% average campaign click rate and 5.58% flow click rate; Campaign Monitor puts a good CTR around 2% to 5% depending on industry. Do not mix campaigns with automations. If clicks lag, check audience intent, CTA match, link placement, mobile rendering, and bot-click filtering.
CTOR: Use it to see whether openers acted. Campaign Monitor cites a 6% to 17% CTOR range, defined as unique clicks divided by unique opens. Inflated opens can make CTOR look worse than it is.
Conversion rate: Use it for purchases, leads, trials, bookings, or activations. Klaviyo reports 0.16% campaign placed-order rate vs. 2.11% flow placed-order rate. Compare within business models, unless you enjoy nonsense math.
Unsubscribe rate: Use it for fatigue and fit. A higher rate can be normal after reactivation, a positioning shift, or harder promotions. Spikes point to frequency, segment quality, expectation mismatch, or low-intent acquisition.
Bounce rate and deliverability: Use these for list hygiene and inbox risk. Separate hard bounces, soft bounces, and temporary deferrals. If trouble starts, check old imports, bad forms, purchased data, SPF, DKIM, DMARC, complaints, spam placement, blocklists, and sudden volume jumps.
Revenue per recipient and ROI: Use RPR for ecommerce and lifecycle priority. Klaviyo says flows generate nearly 18 times higher RPR than campaigns, so compare like with like. Use ROI for budget planning, not creative diagnosis, and include labor, discounts, ESP costs, agency fees, and attribution overlap before cutting email.
Build your benchmark from the inside out
Start with your business model, then narrow the comparison set. Ecommerce, B2B, media, and SaaS email programs should not share one target sheet.
Use this workflow:
- Define the business model and revenue motion.
- Isolate the campaign type, such as an ecommerce abandoned cart flow, B2B webinar nurture, weekly newsletter, or promotional product launch.
- Separate audience cohorts by source, lifecycle stage, recency, and engagement. HubSpot-style segmentation can use criteria like opens, clicks, last activity date, and “last 30 days” filters.
- Align metric definitions before you compare.
- Choose 2 to 3 external references from the closest sources, then sanity-check them against broader marketing benchmarks.
- Compare those sources to your own trailing 3 to 6 month baseline. For RPR, Klaviyo recommends at least one month of campaign data before treating the baseline as useful.
- Set test targets in your marketing metrics plan as ranges, not fixed targets.

For planning, make the target specific: “increase abandoned cart RPR among returning customers” beats “improve email performance.”
Email benchmark checklist: diagnose the right problem
Before you judge email performance, check the benchmark:
- Source fit: platform, region, industry, list type, and business model match.
- Metric definition: click rate, CTR, CTOR, conversion rate, RPR, or ROI mean the same thing.
- Audience cohort: new, warm, lapsed, purchased, paid-acquired, or customer-only.
- Campaign type: newsletter, promo, automated flow, lifecycle email, or B2B nurture.
- List health: bounces stay under control. Treat more than 5% as a red-line issue.
- Deliverability: SPF, DKIM, DMARC, unsubscribe links, and one-click unsubscribe work.
- Conversion path: the landing page, offer, and checkout hold up.
- Next test: change one variable and compare against your own baseline.
Privacy changes made open rates messier. Clicks, conversions, RPR, unsubscribes, bounces, and deliverability usually tell you more.