
Average click rate for email marketing: quick benchmark by source
| Source | Report/date | Dataset or audience | Metric | Avg. click rate / CTR | Caveats |
|---|---|---|---|---|---|
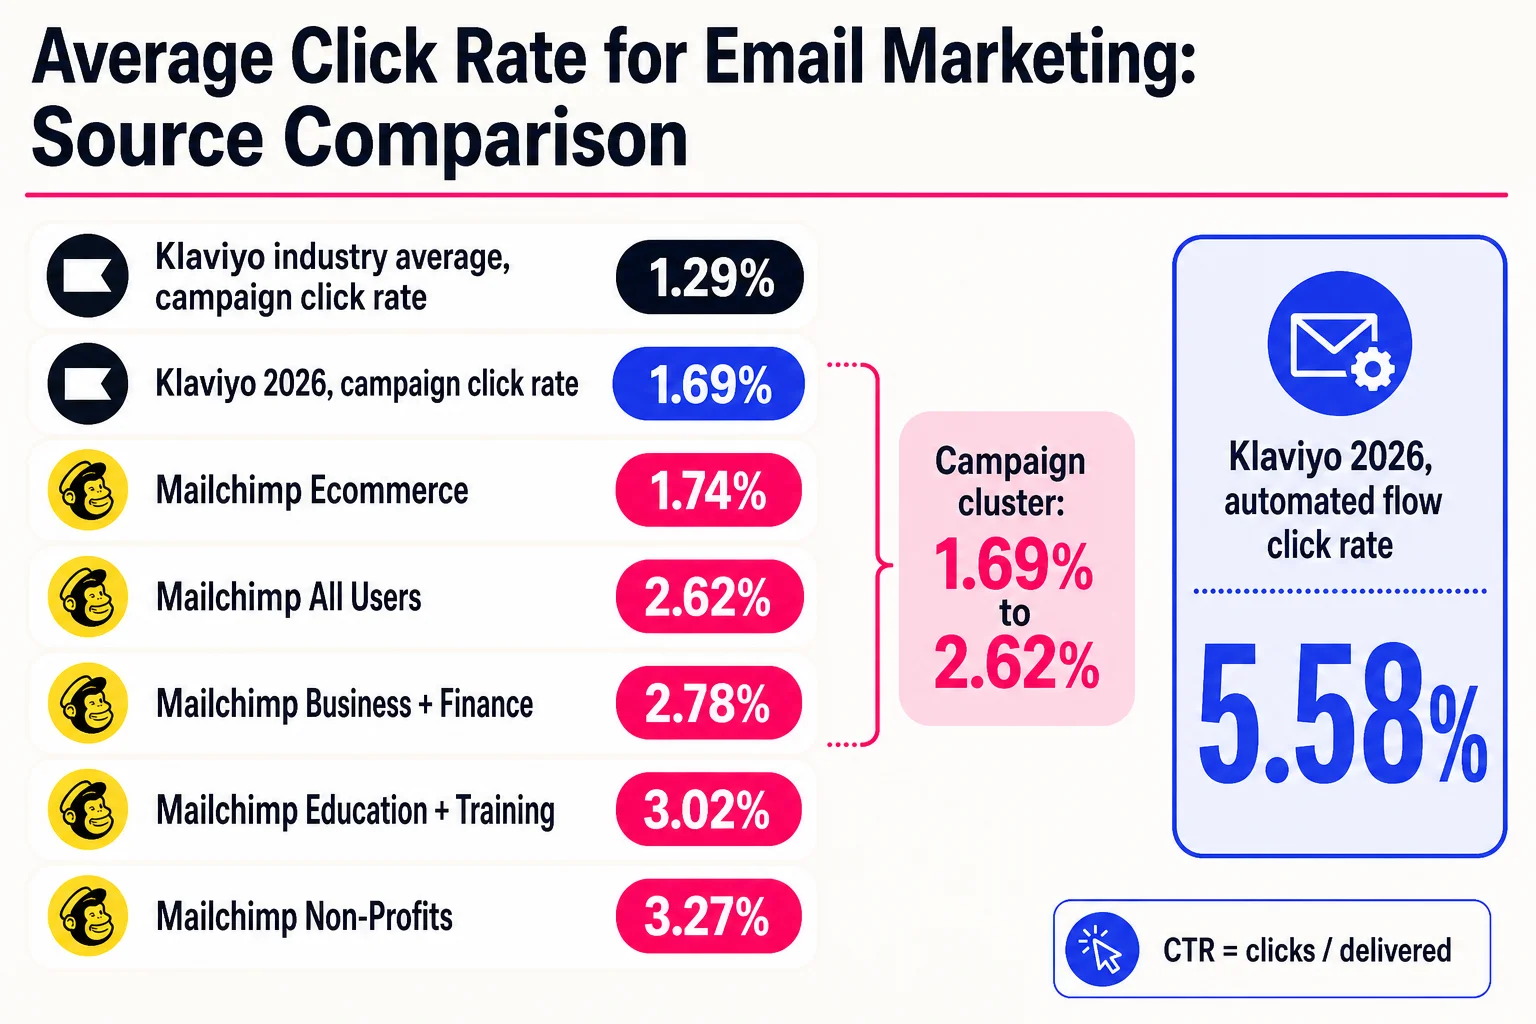
| Mailchimp | Current benchmark page | Mailchimp users across industries | Click rate | 2.62% All Users average | Broad dataset. Industry averages vary, including 1.74% ecommerce, 3.27% Non-Profits, and 3.02% Education + Training. |
| Klaviyo | 2026 benchmark report | Brands in Klaviyo’s dataset | Campaign click rate | 1.69% average campaign click rate | Campaign-only figure. Klaviyo skews ecommerce and owned marketing. |
| Klaviyo | 2026 benchmark report | Automated email flows | Flow click rate | 5.58% average automated flow click rate | Triggered flows should not be compared directly with newsletters or promos. |
| Beauchamp Sullivan & Co | March 2026 ecommerce benchmark | Agency ecommerce clients | Campaign and flow click rate | 1.29% campaign click rate and 3.15% flow click rate | Useful ecommerce view, but from one agency portfolio. |
For most teams, the average click rate for email marketing is a band, not one magic number. Recent sources put typical campaign click rates around 1.69% in Klaviyo’s 2026 data to 2.62% in Mailchimp’s All Users benchmark. Automated flows can run higher because the audience already did something meaningful, which is marketing-speak for “they raised their hand instead of wandering past your booth for the free pen.”
ClickMinded is interpreting third-party benchmark data here, not claiming ownership of those datasets. Use the table as a starting point, then judge your own performance by list quality, send type, industry, and conversion quality. For more context, see our guides to email marketing benchmarks and email marketing statistics.
Use click-rate ranges as a diagnostic, not a scoreboard
Treat the average email click rate as a rough diagnostic range. A normal campaign around 2% to 3% sits near several broad benchmarks, including Mailchimp’s 2.62% all-user average, WebFX’s 2.44% average CTR across industries, and MailBluster’s wider 2.1% to 3.7% range.
| Range | What it usually means | What to check next |
|---|---|---|
| Under 1.5% | Weak fit, low intent, list fatigue, or measurement noise | Segment, offer match, deliverability, bot clicks |
| 1.5% to 3% | Normal range for many broad sends | Audience, industry, and send type |
| 3% to 5% | Strong for many campaigns | Conversion quality and revenue per email |
| 5%+ | More common for triggered flows than newsletters | Compare against similar automations |
One overall average works for a quick pulse check. It gets much less useful when someone compares a cold newsletter to an abandoned-cart flow and starts yelling at a spreadsheet. Compare similar audiences, intent, and send types before making the expensive decision.
Different benchmark sources measure different slices of email
Mailchimp, Campaign Monitor, Klaviyo, Salesforce, Flodesk, and industry articles can all be useful and still disagree. Their datasets come from different customers, campaign types, time windows, and metric definitions. A benchmark can be accurate for its source and still be a bad comparison for your program.
Use benchmarks as context, then keep your own rules consistent. If your team needs a cleaner setup, start with ClickMinded’s guide to email marketing metrics before arguing over whether a 2.4% click rate is fine or tragic.
| Caveat | Why it changes the average click rate |
|---|---|
| Source audience | Klaviyo’s ecommerce-heavy tools will skew differently than a broader small-business dataset like Mailchimp’s email marketing benchmarks. |
| Send type mix | Newsletters, promos, lifecycle flows, abandoned-cart emails, and reactivation campaigns have different intent levels. More automations can make a source look stronger. |
| Time period | A month, quarter, or year can shift with seasonality, privacy changes, and list-growth tactics. |
| Bot filtering | Security scanners can create clicks that no human made. Sources may filter those differently, or explain the filtering poorly. |
| Click metric definition | Some reports use total clicks, unique clicks, clicks divided by delivered emails, or clicks divided by opens. Campaign Monitor separates open and click reporting, so labels matter. |
| Average vs median | Averages can be pulled up by unusually strong campaigns. Medians often describe the typical sender better, but many public pages do not show both. |
Cite the source, copy its definition, and compare it only with campaigns that resemble the same slice of email.
Use the same click formula before comparing results
Email CTR can look better or worse depending on the denominator. Lock the formula first, then compare. ClickMinded’s email marketing metrics guide covers the broader reporting setup.
| Metric | Formula | Best used for | Common mistake |
|---|---|---|---|
| Click rate | Unique clickers / delivered emails | Campaign engagement after bounces | Dividing by sent emails |
| CTR | Clicks or unique clicks / delivered emails | Link engagement, if the tool defines it clearly | Mixing total and unique clicks |
| CTOR | Unique clickers / unique opens | How well the email moved openers to click | Treating CTOR like CTR |
CTOR uses opens as the denominator, so privacy and open tracking issues hit it harder. Sent includes bounces. Delivered does not.
Example, not benchmark evidence: 10,000 delivered emails and 250 unique clickers gives a 2.5% click rate. With 2,000 tracked opens, CTOR is 12.5%. Same campaign, different story.
Average vs good: when a lower click rate can still win
Click quality beats raw click volume. A campaign below the average email CTR can still win if those clicks come from people ready to book, buy, renew, or ask for pricing. A campaign above the email click-through rate average can still burn the room down with curiosity clicks that never convert.
Use benchmarks as a check, then judge the campaign against its actual job. For more on benchmarks, see what makes a good email click rate. For what happens after the click, use email marketing conversion rate.
| What you see | What to check | Likely next move |
|---|---|---|
| High clicks, low conversions | Offer-message fit | Match the landing page, CTA, and promise |
| Low clicks, high conversions | Audience depth | Test segment expansion |
| Low clicks, low conversions | Audience, offer, creative, deliverability | Rebuild the diagnosis |
Segment benchmarks by industry and send type before judging the number
Industry benchmarks help, but the labels rarely match neatly. Mailchimp, MailerLite, Brevo, Salesforce, and Klaviyo all publish click-rate benchmarks, but their datasets, customer mix, metric definitions, and industry categories differ. For a deeper benchmark library, use email marketing benchmarks and email marketing statistics.
| Source | Useful for | Caveat |
|---|---|---|
| Mailchimp industry benchmarks | Click rates by industry | Broad categories, mixed sender types |
| MailerLite industry benchmarks | Industry performance metrics | Platform-specific customer base |
| Brevo email benchmarks | Sector and region benchmarks | Categories differ from other providers |
| Salesforce email benchmarks | Marketing benchmark reporting | Enterprise-heavy mix may skew comparisons |
| Klaviyo ecommerce benchmarks | Ecommerce verticals | Weak for non-commerce comparisons |
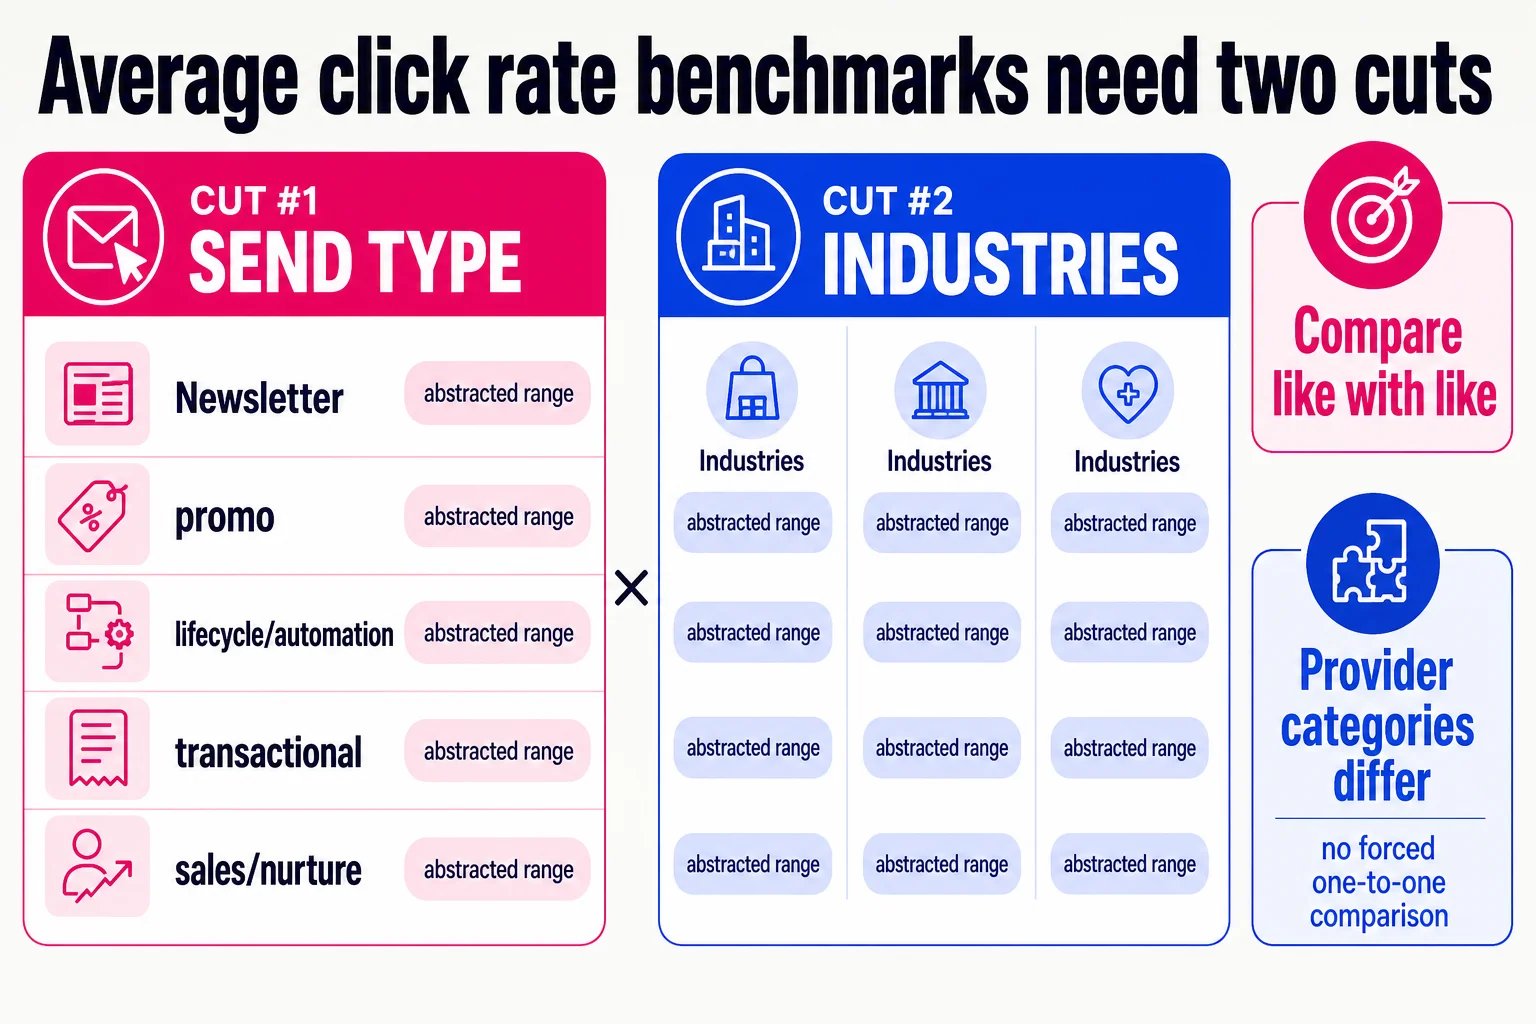
Send type matters just as much. Compare a welcome flow to welcome-flow benchmarks, not a general newsletter average. Newsletters measure recurring audience interest. Promos swing with the offer and timing. Lifecycle, transactional, sales, and nurture emails need benchmarks tied to intent, list warmth, and buying stage.
Opens can diagnose subject lines and audience attention, but they are a related signal, not a click benchmark. See average email open rate.
Clean the clicks before you optimize the email
Treat benchmark gaps as a measurement problem before you treat them as a creative problem. In your email marketing metrics review, compare unique clicks against total clicks, inspect suspicious timing, separate internal and test clicks, monitor domain-level anomalies, watch for all-links-clicked patterns, and confirm what your ESP filters before reporting. Security scanners and privacy filters can inflate clicks, especially when clicks arrive seconds after delivery or hit every link in the message.

Once the data is cleaner, improve the campaign like an adult marketer. Segment by intent. Make one primary CTA obvious. Align the subject line, email body, and landing page so the click has a clear job. Reduce competing links when the email has one main goal. Test the offer angle before obsessing over button color. Keep deliverability basics healthy, since a great CTA cannot save inbox placement. Use email marketing benchmarks as context, then judge clicks by downstream quality.
FAQ: average click rate for email marketing
What is the average click rate for email marketing? Use the source range from earlier as a directional benchmark, then compare the same metric definition and send type.
What is a good average email click rate? A good rate produces qualified traffic, revenue, demos, replies, or another real outcome. See what counts as a good email click rate.
Is average email CTR the same as CTOR? No. CTR uses delivered or sent emails as the denominator. CTOR uses opens.
Why is my click rate below benchmark? Your list intent, offer, audience mix, send type, tracking setup, or bot filtering may differ.
Should I use benchmarks or my own data? Use email marketing benchmarks for context and your own history for decisions.
What matters more, click rate or conversion rate? Conversion rate usually wins. Track both with email marketing conversion rate.