
A practical open-rate range by benchmark source
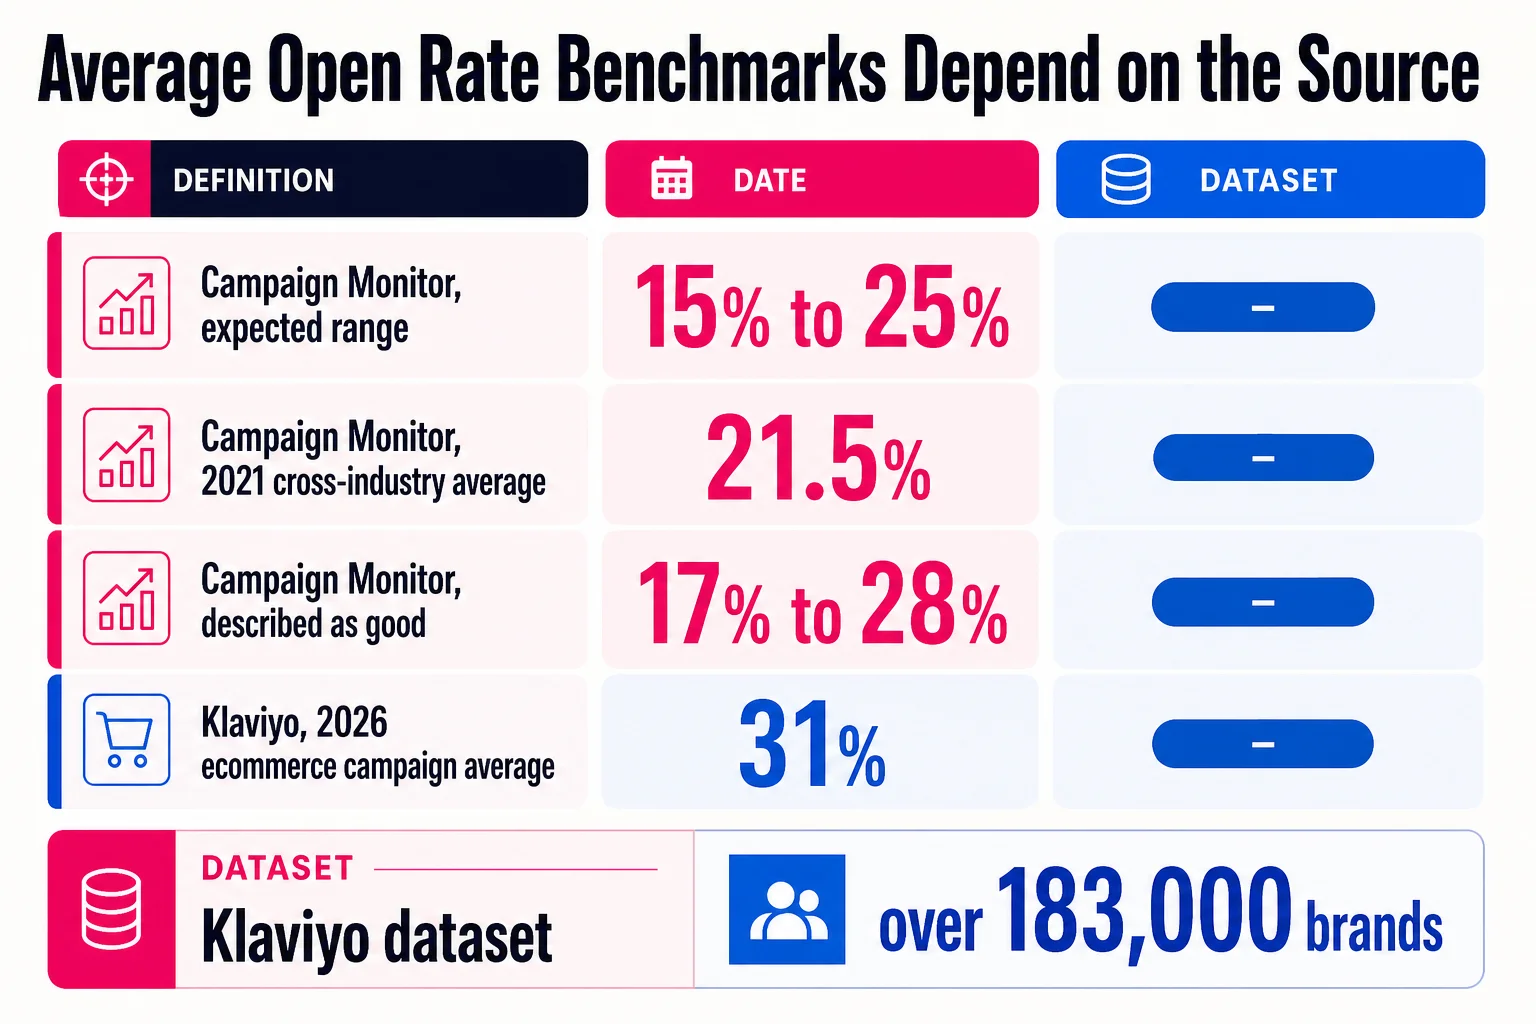
The average open rate for email marketing is a source-dependent number. For normal campaigns, use roughly 15% to 31% as the practical range: Campaign Monitor puts broad campaign expectations around 15% to 25%, while ecommerce-focused Klaviyo benchmarks run higher, around 31% for average campaign opens in 2026.
Pick the source that looks most like your business, list, platform, and send type before judging performance. For a deeper comparison framework, use our guide to email marketing benchmarks alongside the source table below.
| Source | Reported average open rate | Best used for | Caveat |
|---|---|---|---|
| Campaign Monitor | 15% to 25% expected range | General email marketing planning | Broad guidance, not an industry-specific current-year dataset |
| Campaign Monitor | 21.5% | Historical cross-industry comparison from 2021 customer data | Older benchmark, and Apple Mail Privacy Protection affects open tracking |
| Campaign Monitor | 17% to 28% described as good | Quick health check for mixed lists | ”Good” depends on industry, list source, and audience quality |
| Klaviyo | About 31% average ecommerce campaign open rate | Ecommerce campaign sends, based on 2026 analysis of more than 183,000 brands | Ecommerce-only, so it can overstate expectations elsewhere |
| Klaviyo | About 45.1% for top performers | Stretch goals for mature ecommerce programs | Top-decile benchmarks are not normal performance |
| BS&Co portfolio comparison | 37.93% | Agency-side ecommerce comparison | Portfolio reporting can differ from primary ESP definitions |
ClickMinded read: treat 15% to 31% as the honest campaign range until you confirm the source, date, denominator, and Apple Mail Privacy Protection handling.
Current average open rate for email marketing ranges
Use average open rate as a comparison set, not a verdict. A broad promo to a mixed list may sit near the low end, while a newsletter with clear reader intent or a behavior-triggered flow should beat that. Monday.com puts 15% to 20% in average territory and says below 15% needs attention. Mailjet puts a good marketing email open rate around 20% to 25%, with 25% to 35% as a strong average range.
For broader context, keep our email marketing statistics page handy. For publisher-style sends, compare against newsletter open rate and average newsletter open rate data instead of dumping newsletters into the same bucket as every bored Tuesday promo blast.
| Compare against | Starting range | Use this when |
|---|---|---|
| Broad promotional campaigns | 15% to 25% | Sales, product, or announcement emails go to a mixed list |
| Newsletters | 20% to 35% | Readers opted in for recurring content and know the sender |
| Lifecycle or automated flows | 25% to 45% | Recent behavior, intent, or customer status triggers the email |
| Industry-specific benchmarks | Closest source | Your sector has unusual engagement patterns |
Apple Mail Privacy Protection can inflate reported opens by preloading tracking pixels, so treat high ranges carefully when Apple Mail users make up much of your list.
Why average email open rate sources disagree
Benchmark reports disagree because they measure different email pools, then flatten them into one clean-looking average. A Mailchimp benchmark, a Klaviyo ecommerce report, and a Campaign Monitor guide can all be useful, but they are not interchangeable. ClickMinded does not own these third-party datasets. This article compares and interprets them for practical use.
Before treating any average email open rate as your target, check what the source measured.
| Check | What to look for | Why it changes the number |
|---|---|---|
| Dataset | Platform customers, surveyed marketers, agency clients, ecommerce brands, B2B senders | The sample reflects that source’s customer mix |
| Date | Reporting year, collection window, update date | Privacy changes and list behavior make older benchmarks weaker |
| Email type | Newsletter, promo, lifecycle flow, cold sequence, transactional email | Intent drives opens more than the industry label |
| Metric definition | Unique opens, total opens, machine opens, adjusted opens | Open rate is not always counted the same way. Keep definitions beside your email marketing metrics dashboard |
| Calculation method | Mean, median, weighted average, industry average, account-level average | A few huge senders can pull a weighted average away from a normal account |
| Privacy handling | Apple Mail Privacy Protection included, filtered, estimated, or undisclosed | Preloaded pixels can make open rates look higher than human attention |
| Limitations | Sample size, geography, customer segment, methodology notes | Weak disclosure means the number needs a bigger caution label |
Use the source closest to your send type, customer base, and reporting setup. If a benchmark page does not say what data it used, when it measured it, or how it counted opens, treat the number as directional. Useful, yes. Precise down to the decimal place, no.
Choose benchmarks by industry and send type
Industry matters, but campaign purpose usually matters more. A weekly newsletter, a cart recovery email, and a cold outbound sequence do different jobs, so comparing all three to one platform-wide average creates spreadsheet theater. Very official. Very misleading.
| Use case | Better benchmark | Caveat |
|---|---|---|
| Ecommerce promo | Ecommerce cuts from Klaviyo, Mailchimp, or ecommerce agencies | Check whether campaigns and automated flows are separated |
| Lifecycle or automation email | Flow, automation, or triggered-email benchmarks | Welcome, cart, post-purchase, and reactivation emails can behave very differently |
| Newsletter | Newsletter-specific benchmarks and publisher data, plus ClickMinded’s newsletter statistics and average newsletter open rate guidance | Cadence, niche, and list hygiene swing results hard |
| B2B nurture campaign | B2B or industry-specific reports | Job-title targeting and deliverability may matter more than industry |
| Cold outbound sequence | Cold email sequence benchmarks | Open tracking gets noisy when recipients block pixels |
| Broad brand campaign | Broad platform benchmarks from Mailchimp, Campaign Monitor, Brevo, or Salesforce | Use them as a sanity check, not a target |
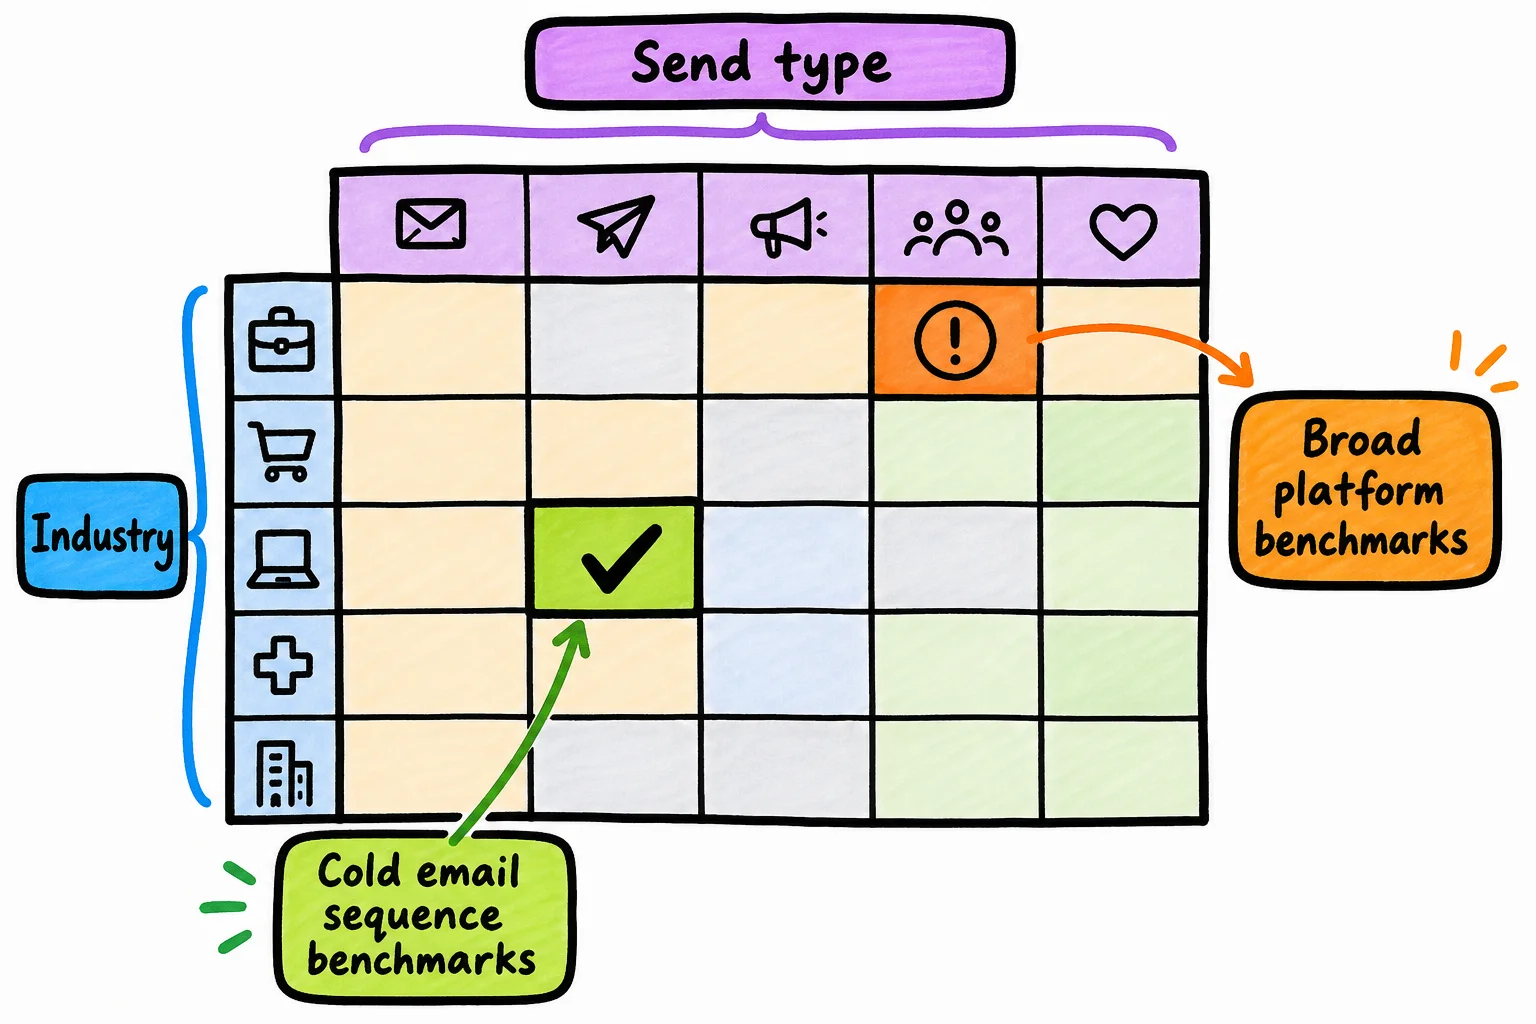
A clean average-open-rate-by-industry table only helps when the source is recent, clear about methodology, and close to your campaign type. For a broader benchmark library, pair this with ClickMinded’s email marketing benchmarks and email marketing statistics pages.
Aim for the benchmark that matches the job
Average is a floor for some campaigns and a warning light for others. If a broad brand newsletter lands near the average for its source, you may be fine, especially if clicks, conversions, or revenue per recipient are healthy. If a welcome email, customer onboarding email, sales follow-up, or high-intent product update only hits the broad average, the list may be telling you something is off.
Use average as the first check, then diagnose against the campaign’s job. A “good” open rate depends on audience intent, list age, send frequency, deliverability, and the value promised in the subject line. ClickMinded’s guide to a good email open rate goes deeper on that judgment call.
After Apple Mail Privacy Protection and similar privacy changes, opens are directional. Pair them with click rate, conversion rate, revenue per recipient, or reply rate before calling a campaign healthy.
Use the formula, then discount the precision
Open rate = unique opens / delivered emails x 100
Delivered emails means sent emails minus bounces. Send 10,000 emails with 300 bounces, and your delivered count is 9,700. Unique opens count delivered recipients who opened at least once. Total opens are different because they include repeat opens from the same person.
Apple Mail Privacy Protection makes the average email open rate fuzzier because Apple can preload tracking pixels before someone reads the email. Campaign Monitor explains that MPP can mask user behavior in Apple Mail environments, which makes opens less reliable. So yes, track opens, but read them alongside email marketing metrics that show actual action.
Improve opens by fixing the list, not gaming the benchmark
Use this checklist in order:
- Fix deliverability first. Check authentication, bounce rate, spam complaints, and inbox placement before rewriting 47 subject lines in a caffeine fog.
- Compare the right segment. Match newsletter to newsletter, customer email to customer email, and cold sequence to cold sequence. Use email marketing benchmarks for context, not judgment day.
- Improve consent and list quality. Clear opt-ins beat bloated lists.
- Test subject lines and preheaders. Test one variable at a time.
- Segment by intent. Buyers, trial users, leads, and dormant subscribers behave differently.
- Clean inactive contacts carefully. Suppress or re-engage before deleting.
- Report opens with clicks, replies, conversions, revenue, and unsubscribe rate. Your email marketing metrics should show business movement, not just curiosity.
FAQ: Average open rate for email marketing
What is the average open rate for email marketing? Use a source-aware range, then compare it with your industry, send type, and platform dataset.
What is a good email open rate? One that beats the right benchmark and supports clicks, replies, or revenue. See our guide to a good email open rate.
What is the average newsletter open rate? It depends on niche and list quality. Use average newsletter open rate and newsletter statistics for context.
Why do Mailchimp and Klaviyo differ? Customer mix, industries, dates, and definitions.
How do I calculate open rate? Unique opens divided by delivered emails, multiplied by 100.
Is open rate still reliable after Apple Mail Privacy Protection? Directional, yes. Clean truth machine, absolutely not.
Which industry source should I use? The one closest to your platform, audience, and campaign type.