
Average newsletter open rate benchmarks by source
A realistic average newsletter open rate is about 25% to 40% for many opt-in newsletters, based on ClickMinded’s read of third-party benchmarks, not ClickMinded-owned platform data. The range is wide because public benchmarks often mix newsletters with promotional campaigns, automations, lifecycle emails, and broader email programs. For more context, see our newsletter statistics and email marketing benchmarks pages.
| Source | Reported open rate/range | Best fit | Caveat |
|---|---|---|---|
| Campaign Monitor | 21.5% average across all industries, based on 2021 data reported in 2022 | Conservative baseline for mixed programs | Older data, likely includes more than newsletters |
| Campaign Monitor | 17% to 28% “good” range by industry | Sanity-checking weak performance | ”Good” is not the same as average |
| Mailchimp | 35.63% “All Users” average, Dec. 2023 | Upper-mid reference for opt-in lists | Mix depends on customer base and campaign types |
| Mailchimp | 40.04% Non-Profits, 35.64% Education and Training, 31.35% Business and Finance, 29.81% Ecommerce, Dec. 2023 | Industry comparisons | Industry labels do not always equal newsletter types |
| Klaviyo | 31% average campaign open rate across all industries | Ecommerce newsletter comparisons | Customer mix can differ from B2B, nonprofit, and creator lists |
| ActiveCampaign | Publishes benchmark guidance, but the available glossary page does not provide a comparable platform-wide average | Metric definitions and framing | Do not treat it as a numeric benchmark without a supported rate |
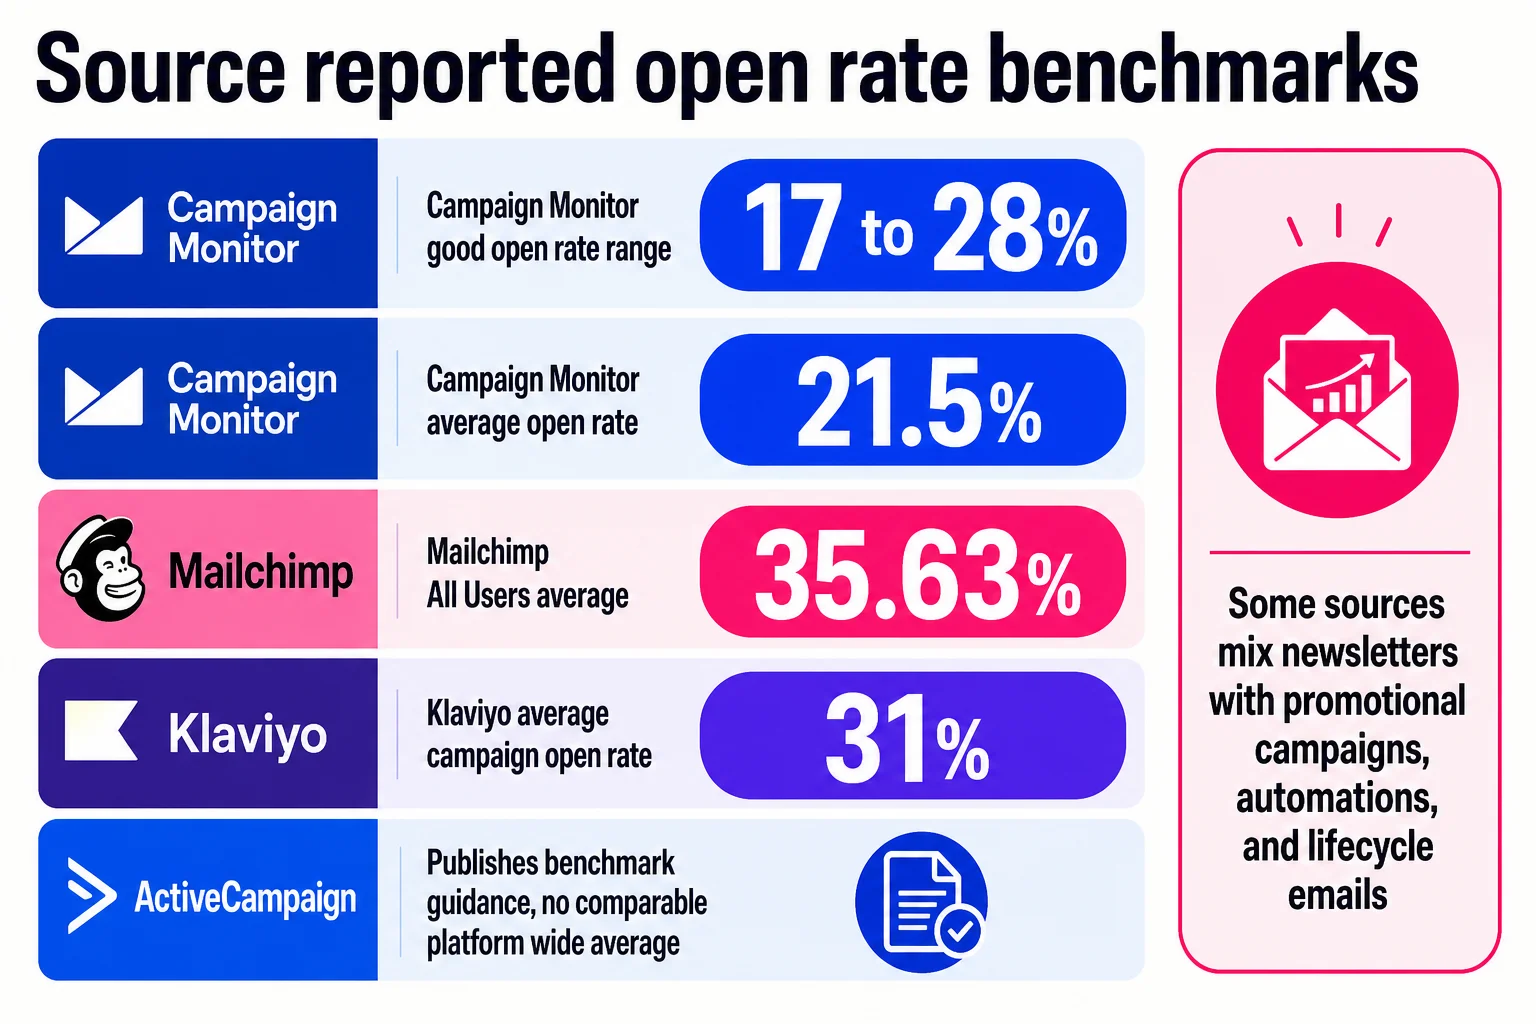
Use 25% to 40% as the working range, then judge against newsletter type, list source, cadence, and industry.
Average newsletter open rate ranges by context
For planning, treat the newsletter average open rate as a range tied to the job the newsletter does. These are ClickMinded interpretation ranges based on third-party datasets, including Campaign Monitor’s 21.5% cross-industry average, Mailchimp’s 35.63% all-user average, and Klaviyo’s 31% average campaign open rate. Use them for planning, forecasting, and client conversations.
| Newsletter context | Realistic average range | Why it moves | Most relevant source types |
|---|---|---|---|
| Broad brand or company newsletter | 25% to 35% | Mixed audience intent, uneven content, list aging | Campaign Monitor, Mailchimp, general average email open rate benchmarks |
| Editorial or creator newsletter | 35% to 50% | Strong opt-in intent, recognizable sender, topic habit | Newsletter platform commentary, creator communities, Mailchimp |
| B2B thought leadership newsletter | 25% to 40% | Role relevance, buying committee breadth, work inbox filtering | B2B benchmark articles, Mailchimp industry cuts, ESP benchmarks |
| Nonprofit or education newsletter | 30% to 45% | Mission affinity and recurring audience interest | Mailchimp nonprofit and education categories, nonprofit email reports |
| Ecommerce newsletter | 25% to 35% | Promo fatigue, sale cadence, deliverability, list source | Klaviyo, Mailchimp ecommerce category, retail benchmark reports |
| Apple-heavy list after MPP | Reported 35% to 55% or higher | Apple Mail Privacy Protection can preload tracking pixels and inflate reported opens | Omeda, beehiiv, Campaign Monitor privacy guidance |
Use the range that matches the list you actually have. A warm customer education list can support a higher assumption than a large ecommerce promo list. A client deck that uses one newsletter open rate average for every audience is asking for the spreadsheet version of a tiny office fire. For reporting context, use our guide to newsletter open rate.
Why newsletter averages differ so much
Newsletter averages swing because the inputs are different. A weekly founder note to opted-in readers does not belong beside a flash sale sent to a mixed retail list.
| Variable | What changes | Better comparison |
|---|---|---|
| List source | Search, referrals, checkout, events, and paid leads behave differently | Match acquisition intent |
| Intent | Analysis readers and coupon buyers do not act the same | Split editorial, education, and promo sends |
| Sender relationship | A known person often gets more attention than a generic brand | Separate person-led and brand-led newsletters |
| Content type | News, curation, product updates, and opinion build different habits | Benchmark by job-to-be-done |
| Cadence | Daily emails can build routine or fatigue | Compare daily to daily, weekly to weekly |
| Audience expectation | A clear signup promise raises consistency | Check signup copy before blaming subject lines |
| Industry | Inbox behavior changes by vertical | Use industry cuts when available |
| Device/client mix | Apple-heavy lists can inflate opens | Pair opens with clicks and downstream behavior |
| Measurement method | Platforms count opens differently | Document rules in your email marketing metrics dashboard |
Compare newsletter types before you compare averages
Putting creator, B2B, nonprofit, and ecommerce newsletters into one average creates fake precision. Same channel, very different subscriber intent.
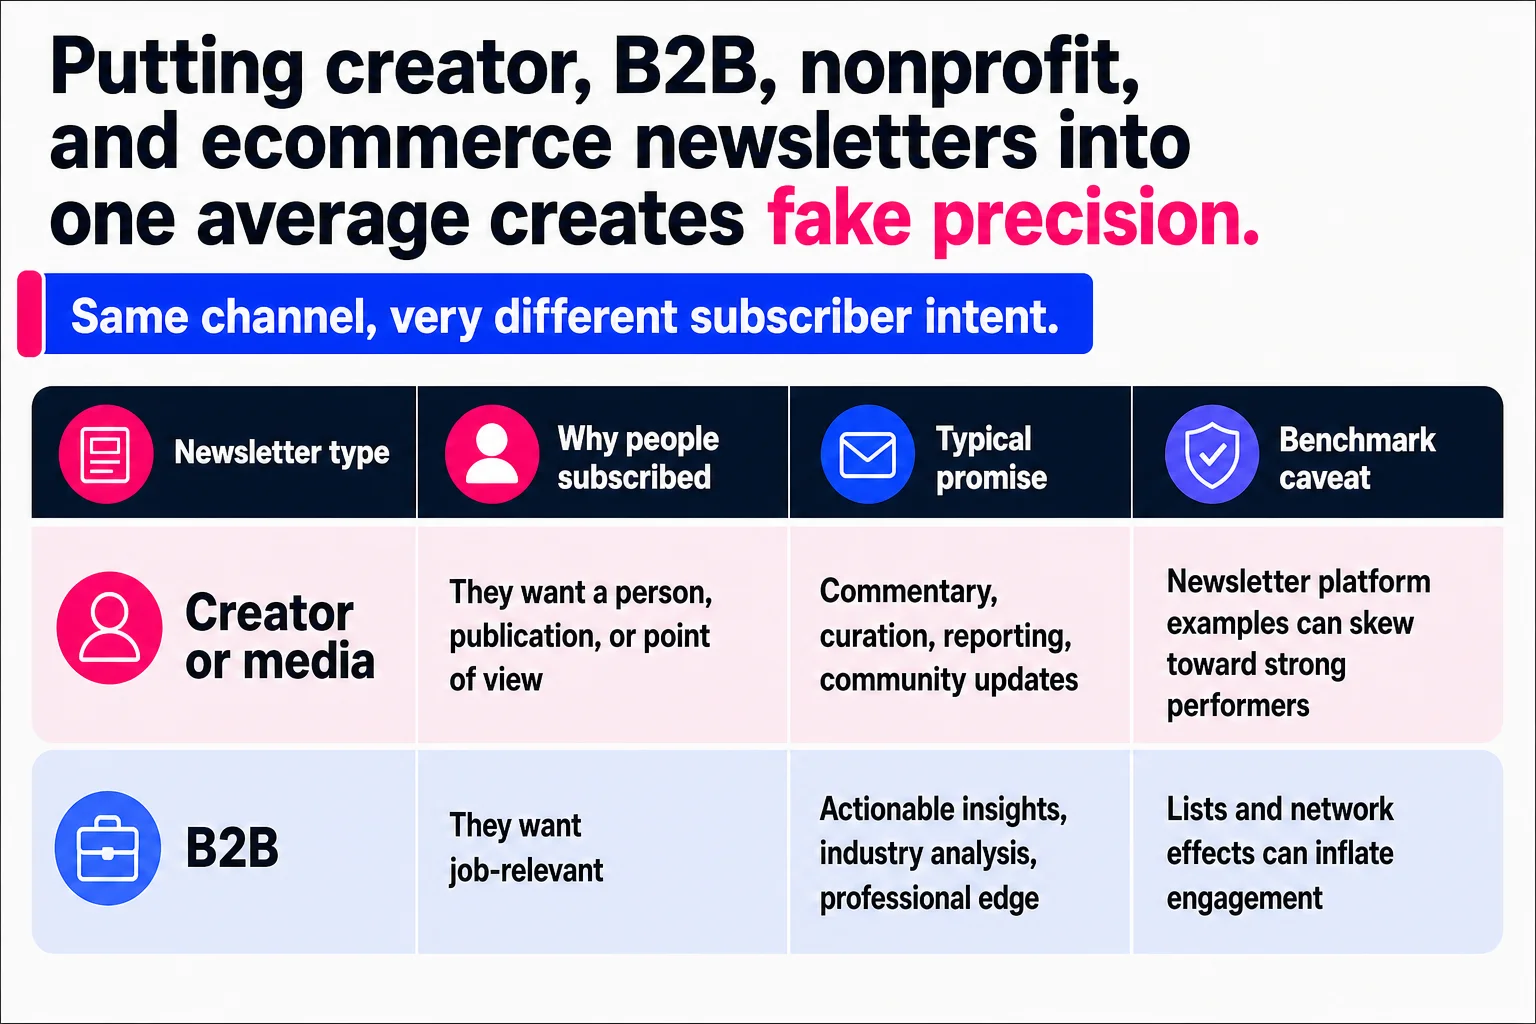
| Newsletter type | Why people subscribed | Typical promise | Benchmark caveat |
|---|---|---|---|
| Creator or media | They want a person, publication, or point of view | Commentary, curation, reporting, community updates | Newsletter platform examples can skew toward strong performers |
| B2B | They want job-relevant information | Industry analysis, product education, webinars, reports | Buying committees, long sales cycles, and work inbox behavior muddy the signal |
| Nonprofit | They care about a mission or local relationship | Impact updates, fundraising appeals, event notes | Appeals and newsletters often get mixed together |
| Ecommerce | They expect products, offers, and launches | Promotions, drops, education, loyalty content | Campaign data may include sales emails, not editorial newsletters |
Use broad email marketing statistics for context, then narrow the comparison to the closest newsletter category you can defend. If the source blends promotional campaigns with editorial sends, label it that way in your reporting.
Judge a good newsletter open rate against your own baseline
A good newsletter open rate beats your own baseline and still looks credible next to relevant benchmarks. A creator newsletter, B2B nurture digest, nonprofit update, and ecommerce content email do not belong on the same scoreboard.
Use average email open rate data for market context, then use your last 6 to 12 sends as the operating baseline. For performance thresholds, see our guide to a good email open rate.
| Performance label | How to interpret it | What to check next |
|---|---|---|
| Underperforming | Below your recent baseline and weak against the closest benchmark | List source, deliverability, subject line fit, send timing |
| Average | In line with your history and comparable benchmarks | Segment quality, cadence, content promise |
| Healthy | Beating your baseline without measurement weirdness | Repeatable topics, engaged segments, signup intent |
| Strong | Consistently above baseline and credible for your newsletter type | Whether growth sources can scale without lowering quality |
Use the same open-rate formula in every report
Calculate newsletter open rate from delivered emails, not total sends, because bounces never had a real chance to open.
| Metric | Formula |
|---|---|
| Newsletter open rate | Unique opens / delivered emails x 100 |
Use unique opens for benchmarking because one subscriber who opens the same newsletter five times should count as one reader, not five. Total opens still matter, but they answer a different question: repeat attention. That can help with sponsor packages, content analysis, or loyal-reader reporting.
For executive or client reporting, define the metric once, then keep it consistent across dashboards. Pair open rate with clicks, conversions, unsubscribes, and deliverability signals from your broader email marketing metrics view.
Treat open rate as a directional metric
Open rate is useful, but it is not a clean read of human attention. Apple Mail Privacy Protection can preload tracking pixels, which can inflate opens, and ESPs do not all handle those privacy opens the same way. Some label, filter, or count them differently.
| Issue | Effect on open rate | What to pair it with |
|---|---|---|
| Apple MPP | Can inflate opens | Clicks, conversions |
| Platform rules | Benchmarks may not match | Same-platform history |
| Image blocking | Can undercount opens | Deliverability, replies |
Use email marketing statistics and email marketing benchmarks as context, then judge your own trend line.

Improve your newsletter open rate, then judge it fairly
Fix the basics first: segment by engagement and signup source, clarify the newsletter promise, test sender name and subject line, clean inactive subscribers, adjust cadence, improve authentication, then compare by newsletter type instead of broad averages. Track the full picture in your email marketing metrics dashboard, not opens alone.
FAQ:
What is the average newsletter open rate? Often 20% to 40%, but source mix matters. Mailchimp publishes industry benchmarks, while beehiiv cites 55% open rates for top-performing newsletters.
What is a good newsletter open rate? Use our good email open rate guide, then compare by list source and newsletter type.
Why do benchmark numbers differ? Datasets vary by sender, industry, and campaign type. See our newsletter open rate and newsletter statistics pages.
Are benchmarks reliable after privacy changes? Useful, yes. Precise, no.