
LinkedIn marketing statistics for B2B marketers in 2026
LinkedIn marketing statistics are oddly under-served as an exact search topic, even though the broader LinkedIn data category is much more active.
The broader intent is much busier. Searches around LinkedIn statistics, LinkedIn statistics 2026, B2B LinkedIn marketing statistics, LinkedIn ads benchmarks, and LinkedIn engagement stats all point to the same question: how much should marketers trust LinkedIn as a B2B channel?
This guide exists because most LinkedIn stats pages mix member counts, ad reach, engagement benchmarks, lead claims, creator commentary, and sales stats into one big undifferentiated list. Fine for trivia. Less fine when you are planning budget, forecasting pipeline, or explaining why the company page post got 11 likes and one of them was the intern.
For broader planning context, keep this beside our guides to marketing statistics, marketing metrics, marketing benchmarks, social media statistics, B2B marketing statistics, and LinkedIn Ads benchmarks.
| Statistic | What it means for marketers | Caveat |
|---|---|---|
| The exact phrase “LinkedIn marketing statistics” is narrower than the broader LinkedIn stats category. | The useful planning intent sits around LinkedIn statistics 2026, LinkedIn B2B marketing statistics, LinkedIn ads statistics, and LinkedIn engagement statistics. | Keyword tools estimate demand. They do not measure actual marketer need. |
| The SERP for “LinkedIn statistics 2026” includes roundups from ConnectSafely, Digital Applied, Scrap.io, and Brenton Way. | Marketers want current LinkedIn data, but the useful version needs source labels and caveats. | Many ranking pages are secondary compilations. Repeated claims are leads to verify, not proof. |
| LinkedIn Business publishes B2B material, including content on how decision-makers consume content. | Official LinkedIn content shows how the platform frames B2B buyer behavior. | Platform claims are still marketing claims. Keep them separate from independent benchmarks. |
| LinkedIn and LinkedIn Pulse host 2026 stat roundups, including 20 LinkedIn statistics to help win deals in 2026. | Some LinkedIn stats content lives on LinkedIn itself. | A LinkedIn URL does not make a claim official. Check the author and source behind the number. |
| Leadfeeder has tactical guidance on retargeting companies on LinkedIn. | LinkedIn’s B2B value often shows up in account targeting, retargeting, and sales follow-up, not only public engagement. | Tactics are useful, but they are not platform-wide benchmarks. |
| LinkedIn ads benchmark pages from sources such as Digital Applied, ZenABM, The B2B House, and Dreamdata report CPC, CTR, CVR, and CPL ranges. | Paid LinkedIn planning needs ranges, especially for B2B SaaS and ABM campaigns. | Benchmarks vary by offer, audience, region, funnel stage, and attribution setup. |
The rest of this guide keeps source types separate: official LinkedIn and Microsoft claims, third-party estimates, benchmark studies, and marketer observations. A registered member count is not monthly active users, and neither number tells you whether your buyers will click, comment, convert, or remember your brand three weeks later.
Start with member scale, then shrink it for planning
LinkedIn’s headline scale is real, but marketers need to label it correctly. LinkedIn is reported to have more than 1.3 billion registered members across more than 200 countries and regions in 2026. That helps with board-deck context, market sizing, and explaining why LinkedIn belongs in a B2B media plan.
Registered members are not monthly active users. They include people who signed up years ago, people who rarely log in, duplicate or stale accounts, and users outside your target market. If someone says, “LinkedIn has 1.3 billion users, so our audience is huge,” stop that sentence before it becomes a forecast.
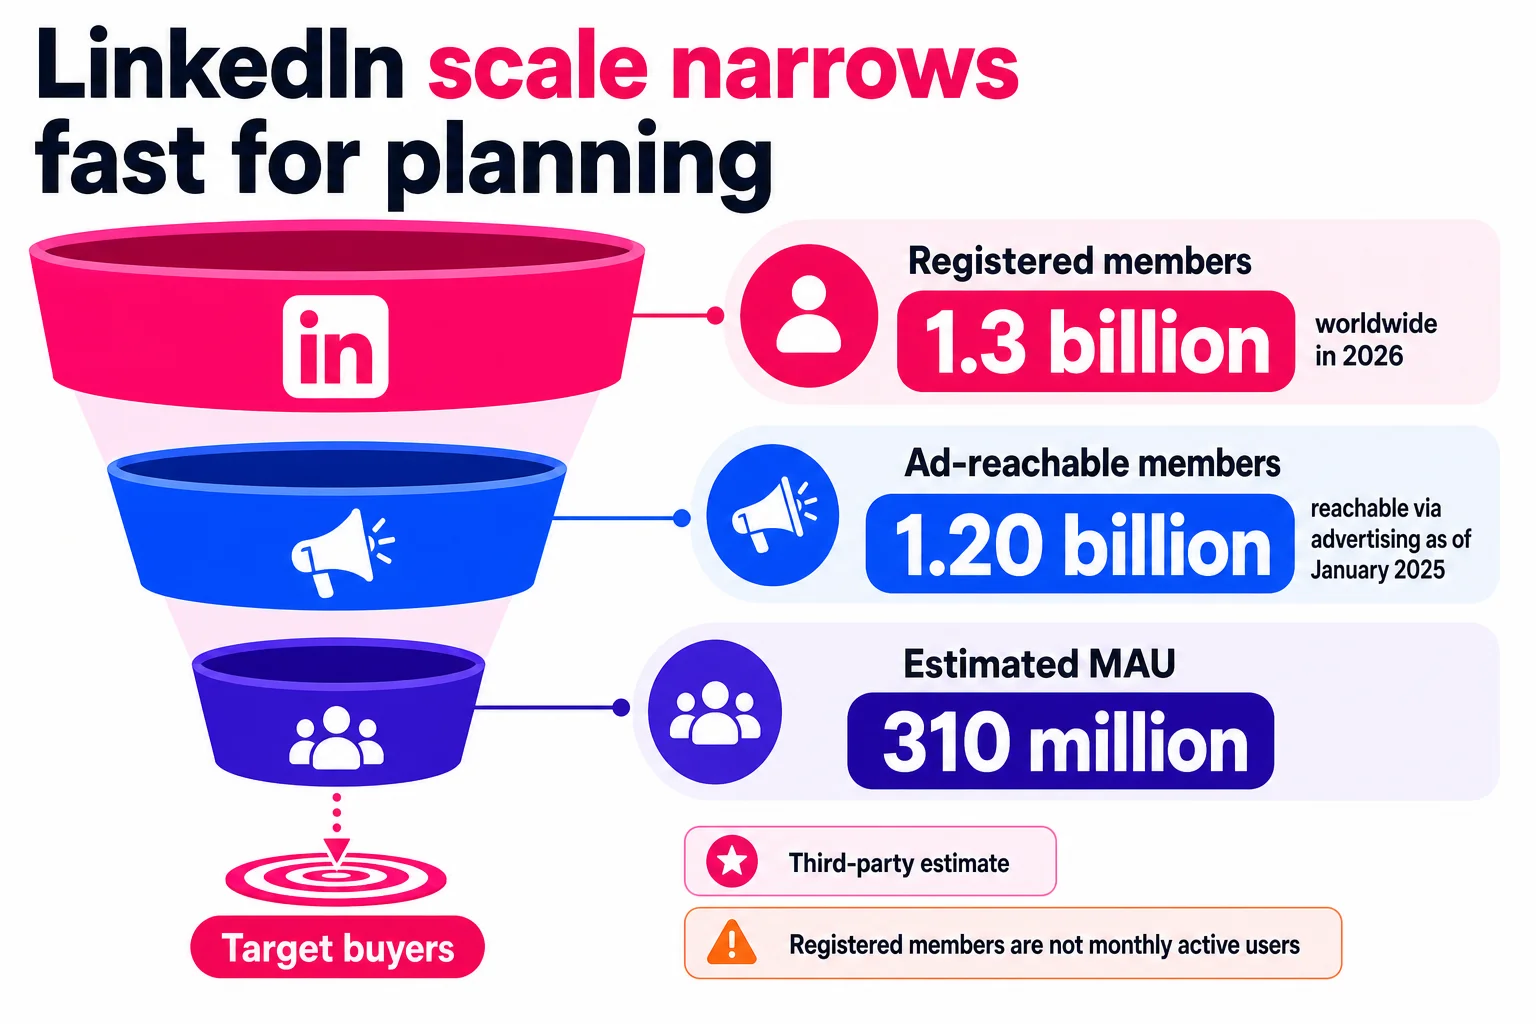
For campaign planning, separate four scale metrics:
| Metric | Best use | What not to assume |
|---|---|---|
| Registered members, about 1.3 billion worldwide in 2026 | Market context, executive buy-in, broad category planning | Do not treat this as monthly active users, daily active users, or reachable buyers |
| Ad-reachable members, reported as 1.20 billion reachable via advertising as of January 2025 | Paid media reach estimates, audience sizing, geography checks | Do not assume every reachable member is active, qualified, or available at your bid |
| Engagement growth, such as older reporting that LinkedIn sessions grew 25% year over year in 2019 | Directional signal that usage can rise even when user counts are unclear | Do not convert session growth into proportional user growth or lead growth |
| Active audience estimates, such as about 310 million MAUs and 134 million DAUs | Conservative planning, channel comparison, social media strategy modeling | Do not present these as audited LinkedIn numbers |
The active-user caveat matters because LinkedIn does not officially disclose monthly active user or daily active user metrics. Some third-party pages estimate about 310 million monthly active users, and some project LinkedIn could reach 600 million MAUs by the end of 2026, but those figures come from outside modeling. Use them as estimates, label them as estimates, and do not mix them with official member counts.
Session and visit metrics need the same discipline. A visit count can include repeat visits, logged-out traffic, and one person opening LinkedIn several times in a month. Older usage data also showed users spending roughly 17 minutes per month on LinkedIn, a useful reminder that presence and attention are separate planning inputs.
For channel comparisons, keep this distinction beside broader social media statistics. LinkedIn’s member base can justify testing the channel. It cannot tell you how many buyers will see your posts, qualify for your campaigns, or remember your offer.
Why LinkedIn is different for B2B lead generation
LinkedIn’s B2B value comes from audience concentration, not raw scale. For marketers comparing channels, the useful question is whether the people on the platform can influence a deal. LinkedIn has long been reported to include 61 million senior-level influencers and 40 million decision-makers, though that figure is widely repeated through aggregator sources and should be treated as a platform-positioning stat rather than a live targeting guarantee.
That concentration helps explain why LinkedIn B2B marketing statistics tend to look stronger than general social media stats. A reported 53% of B2B professionals rank LinkedIn as the most important social media platform, and LinkedIn’s own marketing material focuses heavily on how decision-makers consume content during vendor research and evaluation. The practical takeaway for a B2B team is simple: LinkedIn is usually closer to the buying conversation than consumer-first social platforms.
The famous lead-gen stat needs a warning label. You will often see the claim that LinkedIn generates 80% of B2B social media leads, with some sources also reporting a 2.74% visitor-to-lead conversion rate. Historical benchmark roundups also cite LinkedIn as 277% more effective at lead generation than Facebook and Twitter. Use those as directional benchmarks, not as a promise that your campaign will produce the same share, rate, or lift. Source age, methodology, attribution model, industry, offer type, region, and funnel definition all matter.
Lead generation also needs cleaner language. Lead quality means fit, authority, need, timing, and likelihood to progress. Lead volume means how many form fills, demo requests, or contacts you capture. Pipeline influence means LinkedIn helped touch an opportunity somewhere in the buying process. Closed-won revenue means the deal actually became revenue in your CRM. Those four numbers belong in different columns, because mixing them together creates reporting fiction.

For deeper context on channel planning, compare these figures with broader B2B marketing statistics and your own B2B marketing benchmarks. LinkedIn is strongest when your team sells to a buying committee, because one account can include executives, finance, operations, IT, procurement, and end users who all need different proof before the deal moves.
How to use these stats Use organic LinkedIn when your category needs trust, expertise, and repeated exposure to buyers before they enter an active sales cycle. Use sales-led outreach when you know the account list and need direct conversations with specific roles. Use thought leadership when founders, executives, or subject matter experts can explain the problem better than a product page can. Use paid lead gen when you need controlled targeting, offer testing, and predictable volume, then judge it against qualified pipeline and revenue instead of form fills alone.
LinkedIn engagement statistics: what content formats actually help marketers
LinkedIn engagement statistics help when they point to the next test. They get messy when one average becomes The Number Everyone Must Obey. A 2026 benchmark analysis reports an average LinkedIn engagement rate per post of 5.20%, up 8% year over year, but that blends formats, audiences, page sizes, and posting habits.
For B2B organic planning, format direction matters more than the blended average. Native document posts, usually PDF carousels, show the clearest advantage, with a reported 7.00% average engagement rate based on 1.3 million posts. Polls still work for quick interaction, with an average engagement rate of 4.40%, about double their 2023 performance in that dataset. Long-form text posts around 1,000 to 1,500 characters and single-image posts tend to beat short generic updates, while posts with external links may take a 40% engagement hit.
| Format | Best marketing use | Watch-out |
|---|---|---|
| Text posts | Point-of-view posts, founder notes, objection handling | Big personal profiles can make plain text look easy |
| Documents/carousels | Frameworks, checklists, teardown posts, data summaries | Swipes do not prove buying intent |
| Newsletters | Recurring commentary, product education, executive audience building | Engagement often comes from a warm subscriber base |
| Video | Short demos, event clips, customer proof, founder explainers | Views can fall while useful conversations still happen |
| Polls | Audience research, segmentation prompts, debate starters | Votes are low-friction and can overstate interest |
| Comments | SME participation, sales visibility, account engagement | Easy takes can inflate comment volume |
| Employee advocacy | Launch support, hiring stories, customer wins, events | Shared company copy often dies on arrival |
| Company page posts | Credibility, announcements, retargeting, paid seed content | Company pages are a small part of feed content, roughly 5% in one 2026 analysis |
Company pages usually lag personal profiles. One 2026 benchmark reports 3.85% average engagement for personal profiles versus 2.1% for company pages, while B2B data cited by Digital Applied shows 10.7% engagement on personal thought-leadership posts versus 1.3% on company page posts. Treat those as directional. Personal-profile results depend on the person, audience quality, and comment behavior.
Video needs the same caution. One 2026 format analysis found average LinkedIn video views dropped 36% year over year across all page sizes. That does not kill video for B2B teams. Judge demo clips by qualified comments, profile clicks, demo-page visits, and sales follow-up usefulness, not views alone.
Use engagement rate as a content diagnostic. Test documents against text, polls against question posts, native posts against external-link posts, and employee posts against company-page posts. Track impressions, engagement rate, target-account comments, profile visits, clicks, conversions, and influenced opportunities in separate columns. For channel comparisons, keep LinkedIn results next to your own social media benchmarks.
How to split LinkedIn effort between people and company pages
B2B attention usually starts with a person. LinkedIn content keeps rising, with one 2026 roundup reporting more than 16 million Creator Mode activations and 47% year-over-year growth in content creation. Another reports roughly 2 million posts, articles, and videos published daily. Crowded feed. Tiny logo. You see the issue.
Personal profiles often win on reach. One benchmark claims personal profiles generate 561% more reach than company pages, though the methodology is too thin to treat that as a law. Use it as a planning signal.
| Channel | Best use | Watch for |
|---|---|---|
| Founder or executive profiles | Point of view, credibility, investor and buyer visibility | Ghostwritten sameness, reputation risk |
| Subject matter experts | Technical trust, buyer education, objection handling | Polished posts that flatten expertise |
| Employee advocacy | Wider distribution, event support, launch support | Canned copy, compliance issues, message drift |
| Company pages | Brand proof, hiring, announcements, retargeting audiences | A press-release feed |
Company pages still matter. LinkedIn has more than 69 million company pages, and pages that post weekly are reported to grow followers 7x faster. Keep the page alive, but put the sharper thinking on credible people: founders for strategy, executives for market beliefs, SMEs for depth, and employees for lived proof.
Creator growth does not mean every brand needs a personality machine. Pick people who can earn attention from buyers without sounding like marketing dressed in a blazer.
LinkedIn ads statistics for paid planning
LinkedIn ad planning needs two buckets: official platform capability and performance benchmarks. LinkedIn lets advertisers target by job title, company, industry, seniority, skills, groups, and matched audiences. The cost and conversion numbers below come from agency, analytics, and benchmark datasets, so treat them as planning ranges, not promises.
LinkedIn usually costs more than broad social channels. That can work when the account list is tight, the buying committee is senior, and the deal size can absorb repeated touches across paid, organic, and sales. If you sell a $29 impulse product, LinkedIn CPCs will feel like stepping on a rake. If you sell six-figure software to CFOs at 500-person companies, the math can work.
| Metric | Planning use | Caveat |
|---|---|---|
| CPC around $5.74 | 2026 benchmarks report a cross-industry Sponsored Content CPC of $5.74 | Averages hide swings by region, seniority, audience size, and bid strategy |
| CPC range of $5 to $8 | 2026 guidance cites a typical LinkedIn CPC of $5 to $8 | Reset the model after your first 30 days of data |
| CPM around $33.80 | 2026 Sponsored Content benchmarks cite an average CPM of $33.80 | Narrow executive audiences can cost more |
| CPM range of $30 to $50 | 2026 guidance cites a typical CPM of $30 to $50 | CPM needs account reach and downstream movement beside it |
| CTR around 0.44% to 0.65% | B2B House reports a global Sponsored Content CTR range of 0.44% to 0.65% | CTR depends on offer, format, and audience warmth |
| Lead Gen Form conversion around 6.1% | Digital Applied reports a Lead Gen Form conversion rate of 6.1% | Form fills still need sales qualification and pipeline tracking |
| Thought Leader Ads CTR around 2.68% | ZenABM reports Thought Leader Ads at 2.68% CTR, about 6x single-image ads in its dataset | Single-source figure. Your executive post may not do that |
| ROAS around 121% | Dreamdata-linked analysis reports LinkedIn ads at 121% ROAS, above Google Search at 67% and Meta at 51% | Attribution model, sales cycle length, CRM hygiene, and deal size all matter |
Use these numbers to build the first model, then replace them with your own benchmarks. Our LinkedIn ads benchmarks page has deeper channel ranges, and B2B marketing benchmarks can help compare paid LinkedIn with pipeline, CAC, sales cycle, and close-rate targets. For most B2B teams, CPL only matters after you know how many form fills become qualified opportunities.
Demographic and targeting stats that shape B2B campaign planning
LinkedIn targeting usually starts with professional fit: job function, seniority, industry, company size, skills, region, and account lists. Age and gender can help media planning, but B2B teams should treat them as secondary filters.
| Segment | Marketing use | Caveat |
|---|---|---|
| Role, seniority, industry, company size, skills | Build personas, ABM segments, buying committee campaigns, and exclusions | Profiles can be stale, and job titles are messy |
| Executive reach | Secondary datasets cite 10 million C-level executives, 180 million senior-level influencers, and 63 million decision-makers | Treat as directional until Ads Manager confirms reach |
| Geography | Plan regional GTM, field marketing, and country campaigns | Metro depth varies by market |
| Age | Secondary datasets put 25 to 34 at 50.6% of global users, 18 to 24 at 24.5%, 35 to 54 near 16%, and 55+ at 3.3% | Useful, but rarely the main B2B filter |
| Gender | Global estimates show 56.8% male and 43.2% female | Splits vary by country and industry |
| U.S. income | One dataset reports 53% high-income, 29% middle-income, and 18% low-income | Firmographic fit matters more |
Use demographics to sharpen targeting, then judge quality with forecasted reach, matched-account rates, form quality, and CRM outcomes.
Use LinkedIn stats as labeled inputs
LinkedIn statistics get messy when teams mix source types. Keep official platform claims, ad data, third-party benchmarks, surveys, and CRM data in separate lanes. A reach estimate, Campaign Manager conversion report, creator benchmark, and closed-won pipeline report do different jobs.
Before a stat goes into a plan, pitch, or board slide, check:
| Check | Ask before using the number |
|---|---|
| Source type | Is it LinkedIn data, a benchmark, a survey, an estimate, or your own data? |
| Date | Is it current enough for 2026 planning? |
| Definition | Do “user,” “reach,” “engagement,” “lead,” and “conversion” mean the same thing? |
| Sample | Is it broad, industry-specific, regional, or based on one vendor’s customers? |
| Market | Does it match your region, segment, company size, and buyer seniority? |
| Channel | Is it organic, paid, creator-led, company page, employee advocacy, or Sales Navigator? |
For paid reporting, be picky. LinkedIn conversion tracking can use the Insight Tag, Lead Gen Forms, and Conversions API, but coverage varies. The Insight Tag is client-side and cookie-based, so privacy controls, ad blockers, setup errors, and multi-tag account structures can skew results. Compare LinkedIn conversions with analytics, UTMs, and CRM outcomes before making serious budget calls.
Use marketing statistics for market context, social media benchmarks for channel comparison, linkedin ads benchmarks for paid planning, and b2b marketing benchmarks for pipeline expectations. LinkedIn stats are inputs, not guarantees.
Quick answers to common LinkedIn statistics questions
How many LinkedIn members are there in 2026? Estimates range from about 1.12 billion to 1.3 billion registered members.
Is that monthly active users? No. One estimate puts monthly users at 424 million, or 37.9%; another cites 310 million MAU and 40% daily usage.
Is LinkedIn good for B2B marketing? Yes, but treat the 80% of B2B social leads stat as directional, not gospel.
Which ad stats matter? CPL, lead quality, pipeline, and Lead Gen Form conversion. One benchmark puts Lead Gen Forms at 10% to 15%.
What is good engagement? It depends on format. One benchmark says carousels beat video by 278% and text-only posts by 596%.
Use benchmarks for planning, then replace them with Campaign Manager, CRM, and revenue data.