
A good 2026 benchmark matches your platform, cohort, metric, and goal
A good social media benchmark in 2026 answers one question: “Compared with accounts like ours, on this platform, using the same metric definition, are we performing within a healthy range?”
That last part matters. Averages are useful for orientation and dangerous for diagnosis. If a “good” engagement rate often falls somewhere around 1% to 5%, that can help you sanity-check a dashboard. Hootsuite’s engagement rate guidance gives that broad range while also warning that benchmarks vary by platform and industry. Keep that warning attached to every benchmark comparison.
Your LinkedIn company page, a TikTok creator account, a paid-supported Instagram Reel, and a Facebook page for a local services business should not be judged against the same number. The audience is different. The feed behavior is different. The intent is different. The denominator may be different too, which is where benchmark comparisons become hard to trust.
For this guide, ClickMinded is compiling and interpreting third-party benchmark data. We are not claiming to own proprietary social benchmark data. When we cite a specific number, we will link to the source or label it as a planning range synthesized from cited sources. For metric definitions, formulas, and dashboard setup, use social media metrics. For broader context across channels, our marketing benchmarks hub covers benchmark thinking beyond social.
The best benchmark set for a growth team usually filters by platform, industry or business model, audience size, content format, and objective. That means comparing Instagram to Instagram, SaaS to SaaS, small accounts to small accounts, Reels to Reels, and awareness campaigns to awareness campaigns. That extra filtering is what keeps a healthy campaign from being judged against the wrong average.
Hootsuite’s public 2026 benchmark resource frames benchmarks as context for goal-setting and comparison against similar brands, and its tool includes metrics such as impressions, reach, followers, audience growth rate, engagement rate, video plays, posting frequency, clicks, and shares. That is the right direction: compare against the closest useful cohort before you decide whether a number is good, weak, or just normal.
Social media benchmark ranges by metric and platform
Use this as a first-pass sorting tool. The real target should come from the closest cohort you can find: industry, audience size, platform, format, and organic versus paid.
| Metric | Useful benchmark or planning range | Best used for | Caveat |
|---|---|---|---|
| Engagement rate | Directly sourced examples: TikTok average engagement near 3.70%; LinkedIn median near 6.1%; Facebook near 5.6%; Instagram near 5.4%; Instagram brand average near 0.45%. | Checking whether organic content is getting attention relative to similar accounts. | These sources use different samples and formulas. Do not compare them directly unless the denominator matches. Reach-based, follower-based, and post-level medians can tell very different stories. |
| Follower growth rate | No clean universal benchmark in the cited 2025 to 2026 sources. Use your trailing 3 to 6 month baseline, then compare against platform and industry reports where available. | Setting audience growth goals and spotting stalled distribution. | Small accounts can show big percentage gains from tiny absolute growth. Mature accounts may grow slowly and still drive revenue. |
| Reach and impressions | Planning range synthesized from cited sources: compare by platform, content format, and industry. Dash Social publishes 2026 reach, engagement, and format benchmarks across 12 industries. | Diagnosing distribution, creative fit, and algorithmic pickup. | Reach is people or accounts reached. Impressions are total exposures. Keep them separate in reporting. |
| Post frequency | Directly sourced examples: Hootsuite reports an overall cadence near 2 posts per week for Facebook, Instagram, and LinkedIn. Socialinsider via Planable reports brands posting around 5 times per week on Instagram and 2 times per week on TikTok. | Planning publishing capacity and testing whether volume is holding back reach. | Outliers are real. Hootsuite reports Instagram education near 28 posts per week and X entertainment near 24 posts per week. |
| Video views and completion | Planning range synthesized from cited sources: benchmark by platform and format, especially TikTok, Instagram Reels, YouTube Shorts, and long-form YouTube. | Measuring hook strength, retention, and watch time. | A “view” varies by platform. Compare 15-second clips with 15-second clips, not webinars. |
| Click-through rate | Planning range synthesized from cited sources: use platform, placement, organic versus paid, and campaign objective before setting a target. | Judging whether attention is turning into site visits or offer interest. | Low CTR may be fine for awareness content. High CTR with weak conversion may point to a landing page or offer problem. |
| Conversion and lead metrics | Planning range synthesized from cited sources and your own funnel data. For broader KPI definitions, use marketing metrics. | Forecasting leads, sales, signups, and pipeline from social traffic. | Public reports rarely give universal lead benchmarks that work across B2B, ecommerce, creator, and local service funnels. Separate lead quality from lead volume. |
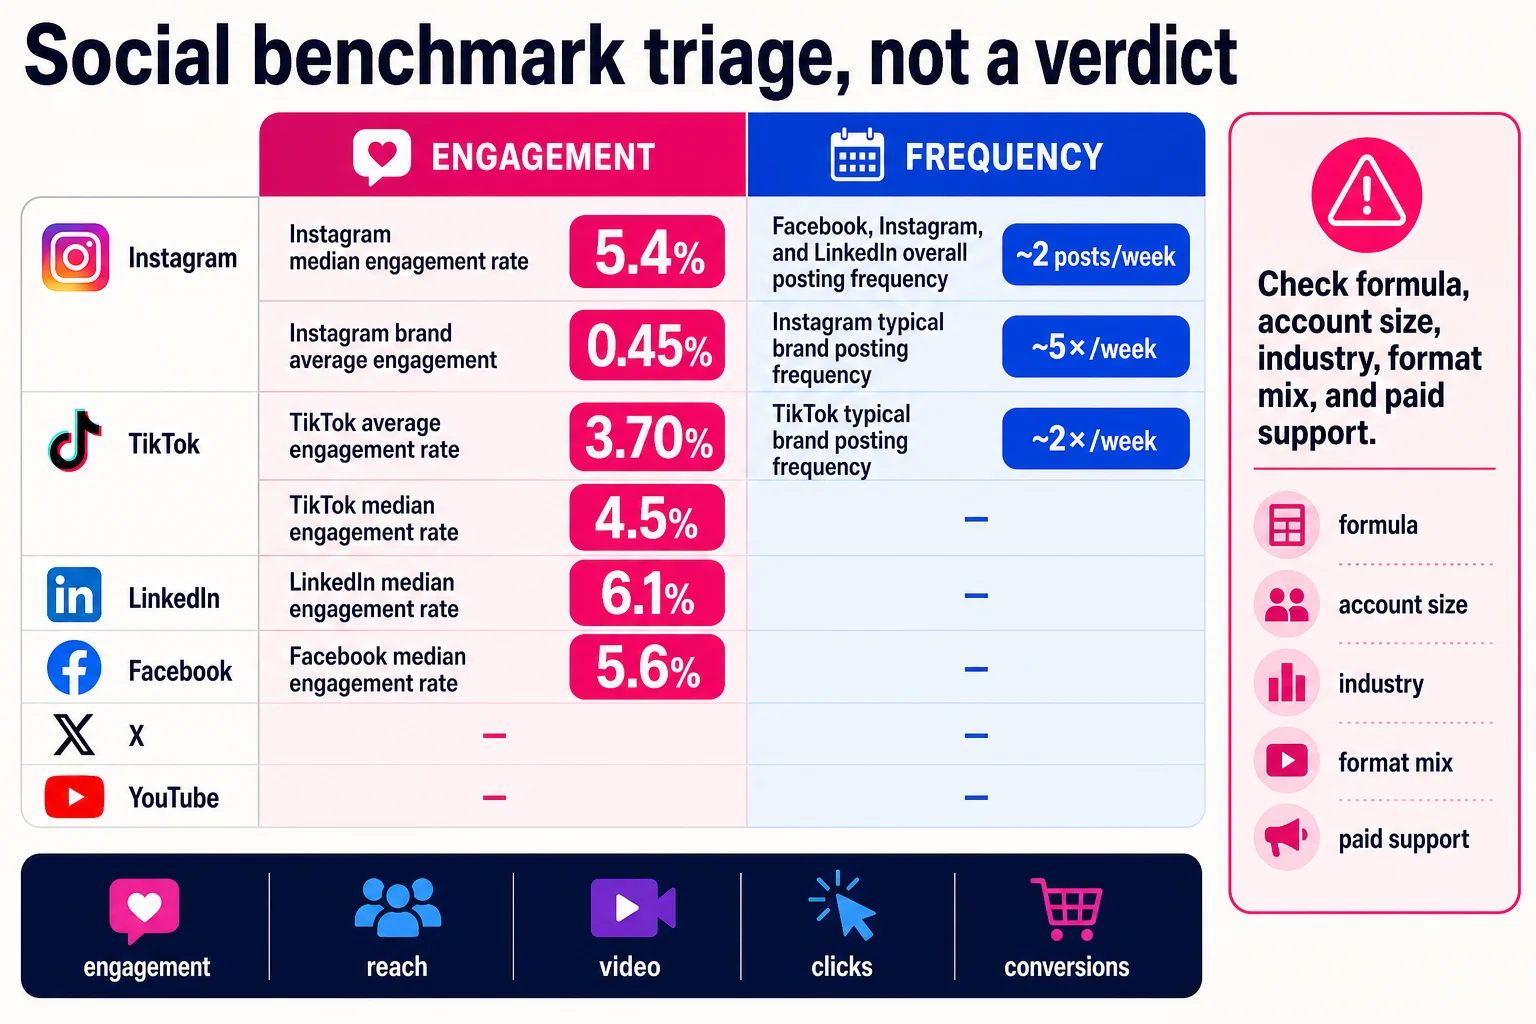
Treat the table as triage. If your TikTok engagement is below 3.70%, the account is not automatically broken. If your LinkedIn engagement is near 6.1%, the program is not automatically healthy. Check the formula, account size, industry, format mix, paid support, and goal.
For reporting, pair these ranges with your own 90-day baseline and a broader benchmark reference from marketing benchmarks. If a number goes into a forecast or executive deck, label it as directly sourced or as a planning range synthesized from cited reports. That label keeps planning ranges from becoming unsupported targets.
Segment social media benchmarks before you judge performance
A cross-channel average weakens social media benchmarks because it blends platforms, audiences, content types, and goals into one tidy number. Tidy numbers look nice in a slide deck, but they can make a healthy program look weak or a weak program look stronger than it is.
Platform norms are the first split. A Facebook average does not tell you much about TikTok, and a LinkedIn engagement rate does not mean the same thing as an Instagram engagement rate. Hootsuite’s cross-industry Facebook engagement benchmark is reported as 1.30%, while Hootsuite’s January 2025 data is summarized as 3.9% average LinkedIn engagement for consumer goods and retail. Those numbers come from different platform contexts, so ranking them like-for-like is misleading.
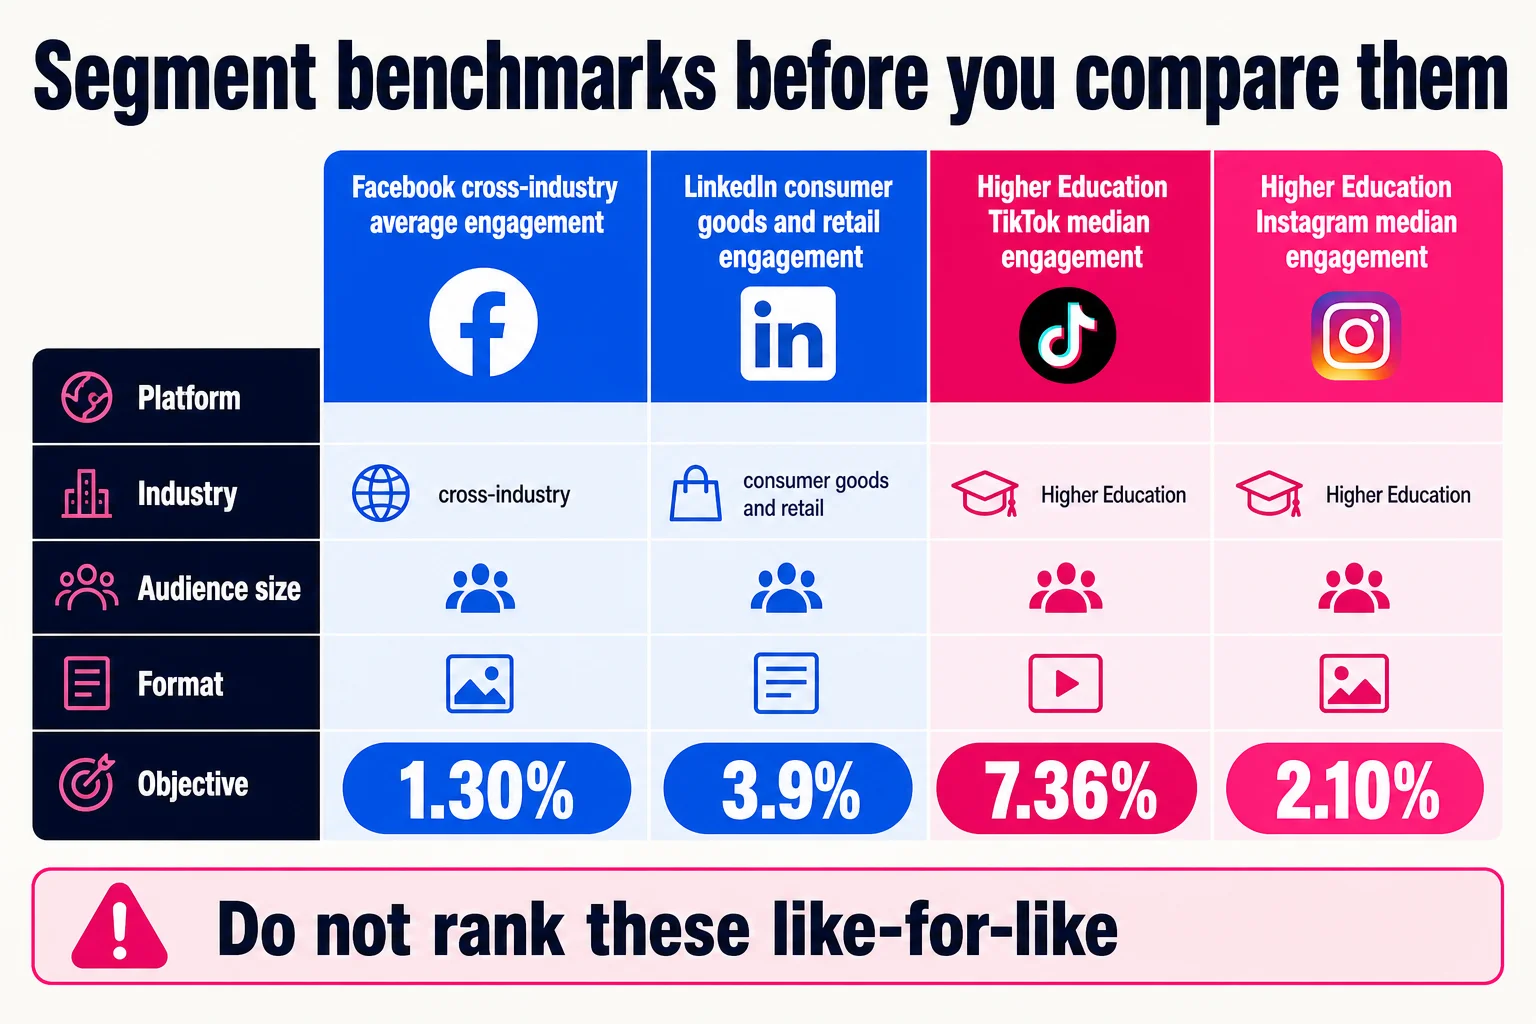
Industry changes the baseline fast. Rival IQ’s 2025 industry benchmark data is summarized as 7.36% median TikTok engagement for Higher Education, compared with 2.10% median Instagram engagement for Higher Education. A 2% Instagram engagement rate may be strong for that sector, while a 2% TikTok engagement rate can sit below the sector norm. Nonprofits show the same problem: nonprofit Instagram engagement is summarized at 0.56%, while nonprofit TikTok medians appear around 2.17% to 3.04% in different slices.
Follower count changes the math too. Smaller accounts often have warmer audiences and higher engagement rates. Larger accounts may have lower rates because the audience is broader, older, or less uniformly interested. A founder with 4,000 relevant LinkedIn followers can beat a brand page with 80,000 passive followers, even if the brand page wins on raw likes.
Format matters. A carousel, short video, long-form YouTube video, text post, livestream, and link post all ask for different audience behavior. A watch-time problem is different from a click problem. A save-heavy Instagram carousel is different from a comment-heavy LinkedIn post.
Paid support belongs in its own lane. A boosted awareness post may reach cold users who scroll past, while a retargeting ad may reach fewer people and produce better clicks or leads. Keep organic and paid benchmarks separate unless the report clearly blends them.
Pick the benchmark after you pick the metric. If the goal is demand creation, engagement and reach matter. If the goal is lead capture, CTR, conversion rate, lead quality, and pipeline matter more. For definitions and KPI selection, use marketing metrics before comparing your numbers to any public benchmark.
Metric definitions: The same name does not always mean the same math
Social media engagement benchmarks get messy because the same label can hide different math. “Engagement rate” might mean engagements divided by followers, reach, impressions, or posts. Same account, same week, very different percentages. Fun little reporting grenade.
Use a metric dictionary before you benchmark. If your dashboard has five “engagement” columns and nobody knows each denominator, fix that first. The definitions in marketing metrics can help standardize KPI language before the benchmark conversation starts.
| Metric | Common formula | Use it for | Watch for |
|---|---|---|---|
| Engagement rate by followers | Total engagements / followers | Quick account comparison | Penalizes large accounts and ignores who saw the post |
| Engagement rate by reach | Total engagements / accounts reached | Post quality and audience response | Requires reliable reach data |
| Engagement rate by impressions | Total engagements / impressions | Paid and high-frequency campaigns | Drops when one person sees the post multiple times |
| Engagements per post | Total engagements / posts | Cadence and output reviews | Can reward fewer posts if one post spikes |
| Reach | Unique accounts or people who saw content | Audience penetration | Does not show repeat exposure |
| Impressions or views | Total times content appeared or was viewed | Distribution volume and frequency | Can count the same person more than once |
| Follower growth rate | Net new followers / starting followers | Audience growth tracking | Looks inflated for small accounts |
| CTR | Clicks / impressions | Link and ad performance | ”All clicks” and “link clicks” differ |
| Conversion rate | Conversions / clicks, sessions, or impressions | Lead and revenue planning | Breaks when attribution differs |
Reach and impressions are the classic trap. Reach counts unique people or accounts. Impressions count total appearances, including repeat exposure, as Meta explains in its page on reach and impressions and Sprout Social covers in its breakdown of reach versus impressions.
Video metrics make the mess worse. Meta has moved toward a unified “views” metric across Facebook and Instagram, and views can include multiple views from the same user. Depending on the report, a video view can mean a start, a 3-second view, a ThruPlay, or a completion milestone. ThruPlay counts videos played to completion or for at least 15 seconds.

CTR and conversion metrics need the same discipline. CTR usually means clicks divided by impressions, but “clicks” may include all clicks or only link clicks. Conversion rate may use clicks, sessions, leads, purchases, or pipeline-qualified leads as the denominator. Compare benchmarks only when the numerator and denominator match your report.
Platform benchmarks only work against the right platform behavior
Instagram benchmarks are useful for engagement rate, reach rate, follower growth, and format splits across Reels, carousels, Stories, and static posts. A brand account at 1% engagement or higher can land in the top 25% of brand accounts, while other 2026 datasets put averages lower, including about 0.48% across content types and 0.98% at the platform level. Compare by industry, account size, and format before judging.
TikTok needs view rate, average watch time, completion rate, shares, saves, follower growth, and profile clicks. Engagement rate can mislead because distribution often comes from the For You feed, not followers. Emplifi reports TikTok led brand follower growth at 200%+ year over year, but treat that as context. Compare similar posting volume, creative style, and audience age.
LinkedIn needs more judgment. Track engagement rate, comment quality, follower growth, CTR, and lead conversion, but weigh audience quality heavily. A quiet post that reaches buyers or hiring managers can beat a loud post loved by peers who will never buy. If niche benchmarks are thin, use first-party history by post type and audience segment.
Facebook benchmarks work best for reach, impressions, link clicks, video views, comments, shares, and paid versus organic split. Compare against prior reach, paid support, audience frequency, and conversion path.
X/Twitter benchmarks should cover impressions, engagement rate, reposts, replies, profile visits, link CTR, and referral conversions. Compare similar posting frequency, topic speed, and audience intent.
YouTube is search plus recommendations. Watch time, retention, impressions CTR, returning viewers, and subscriber conversion matter more than likes. Compare by topic, length, traffic source, and intent.
A quick source quality check before a benchmark hits your deck
Treat every social media benchmarks report like a dataset with a sales page attached. Useful, often. Neutral, rarely.
Hootsuite says its benchmarks come from social profiles connected to Hootsuite Analytics and has referenced over 1 million social posts. Helpful, but that cohort is Hootsuite-connected accounts, not the whole internet. Public pages do not always break out sample size by industry, geography, customer mix, or paid versus organic activity.
Before a number hits a forecast, audit, client deck, or dashboard, check whether the date range is current, the cohort is disclosed, the geography is shown, and the metric formula is clear. Engagements divided by reach is different from engagements divided by followers, and paid reach can warp an organic benchmark fast.
Be careful with pages that recycle stats without the cohort, formula, or date. Our marketing statistics guide keeps more context-dependent numbers, but the source notes still matter.
Turn benchmarks into targets you can actually manage
Use social media benchmarks as guardrails, then compare them with your own trailing 90 to 180 day baseline. Your account history is usually the cleanest cohort because the audience, offer, posting mix, and brand recognition are already baked in.
If the metric connects to revenue, leads, or pipeline, do not stop at engagement. Tie social performance to conversion benchmarks, lead quality, sales cycle stage, and attribution assumptions. The broader marketing benchmarks hub helps when social sits beside SEO, paid, email, or lifecycle reporting. Keep formulas aligned with your internal marketing metrics glossary, and use outside marketing statistics as context, not marching orders.

Before setting a target, pick the business objective: awareness, audience growth, traffic, leads, pipeline, or retention. Then choose the platform. Instagram, TikTok, LinkedIn, Facebook, X, and YouTube reward different behaviors. Match the metric definition, especially engagement rate denominator, reach, impressions, view threshold, CTR, and conversion rate. Match the cohort by industry, audience size, geography, organic versus paid support, and content format. Compare that with your baseline, then set test targets by metric, budget, and time period. Please, not by vibes.
When performance misses, diagnose before reacting. Weak reach points to distribution, cadence, format, or audience fit. Weak engagement points to creative, hook, relevance, or timing. Strong clicks with weak leads points to the landing page, offer, or audience intent.