
Measure content by the job it is supposed to do
| Content job | Primary question | Useful metrics | Business outcome |
|---|---|---|---|
| Discovery | Can the right people find it? | Impressions, rankings, clicks, CTR, new users | Qualified organic acquisition |
| Engagement | Do visitors use it once they arrive? | Scroll depth, engaged sessions, time on page, returning visitors | Higher intent, better audience fit |
| Conversion | Does it create a useful next step? | CTA clicks, form starts, email opt-ins, trial starts | Leads, subscribers, purchases, demo requests |
| Pipeline | Does it influence sales progress? | MQLs, SQLs, influenced opportunities, sales assists | Pipeline, win rate, revenue, CAC payback |
| Retention | Does it help customers stay and grow? | Returning users, product education views, community activity | Retention, expansion, lower support load |
| Compounding SEO value | Does it keep earning attention over time? | Backlinks, ranking spread, organic clicks, assisted conversions | Lower blended acquisition cost, durable demand |
Content marketing metrics are the observable measures in the table: impressions, clicks, scroll depth, backlinks, opt-ins, conversion rate, pipeline velocity, churn, and the rest of the dashboard confetti. Content marketing KPIs are the few measures you choose because they connect to a business objective. A post can have 40 trackable metrics and still have only two KPIs worth bringing into the Monday meeting.
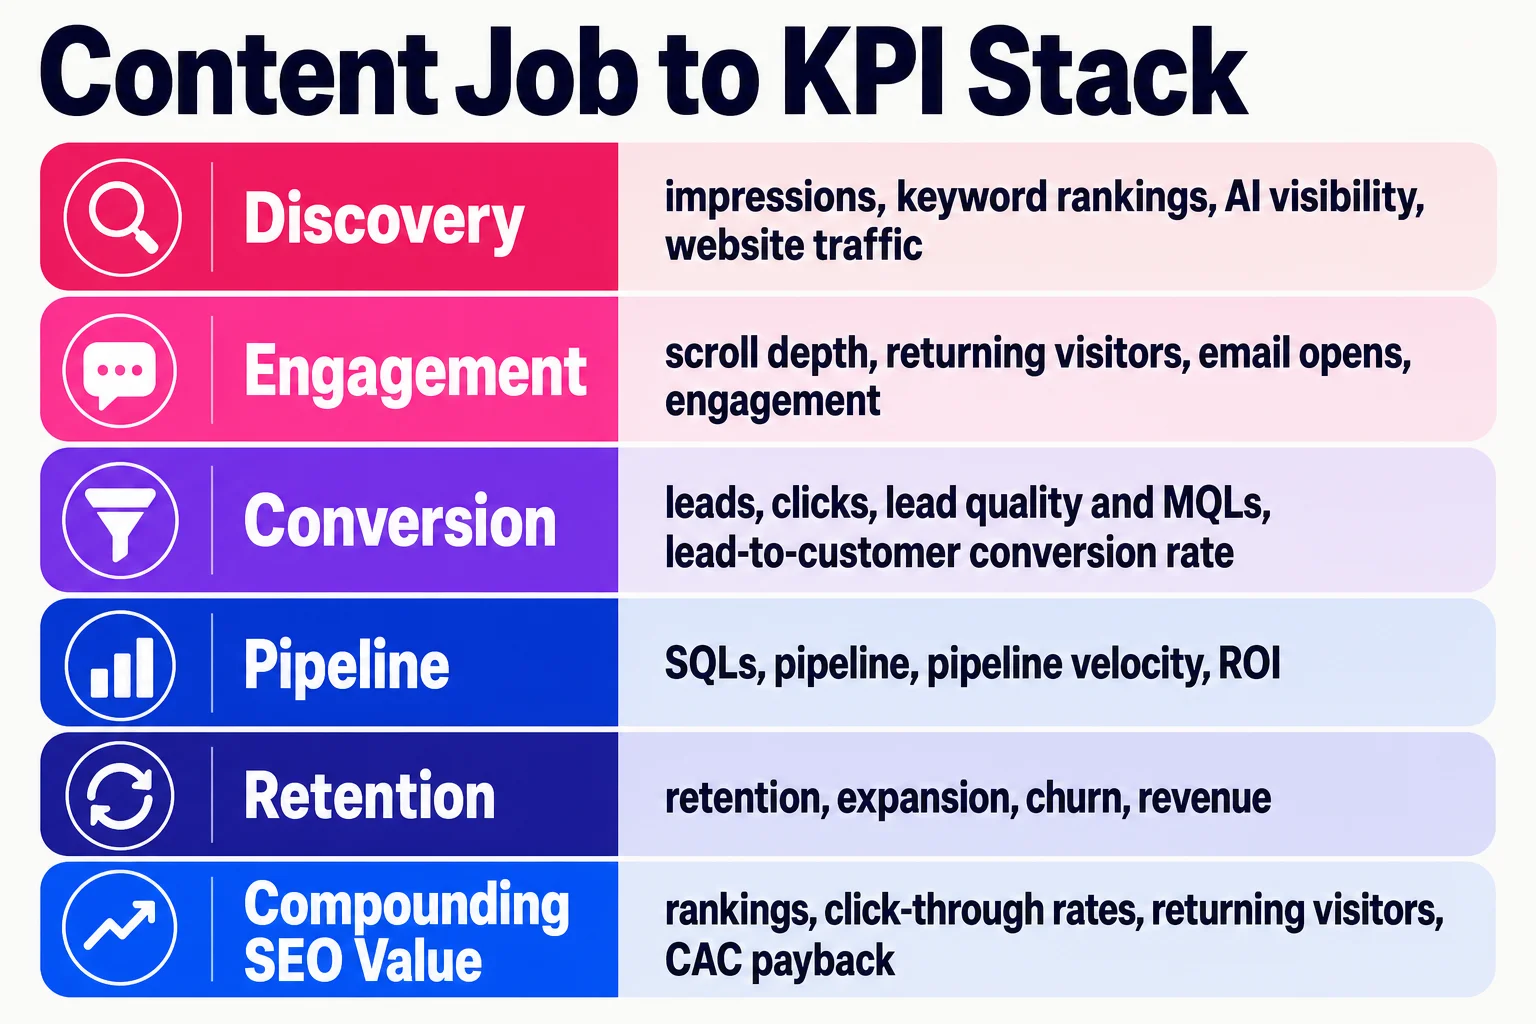
Leading indicators are early signals: rankings, scroll depth, returning visitors, email opens, SQLs. Outcomes are the business results: leads, pipeline, revenue, retention, expansion, and CAC payback.
This guide starts from the broader marketing metrics frame, then narrows it for content teams. HubSpot’s 2026 marketing data says marketers care most about lead quality and MQLs at 39%, lead-to-customer conversion rate at 34%, ROI at 31%, CAC at 30%, and lead volume at 29%. Those are business measures. They still need diagnostic metrics underneath them.
Traffic alone is a weak judge. Sometimes it is demand. Sometimes it is noise wearing a nice blazer. Measure content by the job it was hired to do.
Acquisition and SEO content metrics: measure whether the right people can find the content
Search Console shows how content appears in Google Search. GA4 shows what visitors do after they arrive. Read them together, but do not expect a clean match: GSC reports search clicks, while GA4 reports sessions by channel. Timing, attribution, privacy thresholds, and measurement rules create gaps, and Google’s Search Console integration notes that the tools use different data sources and processing rules.
In GSC, watch organic clicks, impressions, CTR, average position, indexed pages, branded queries, and non-branded queries. Organic CTR = clicks / impressions. Treat average position as diagnostic because it blends queries, devices, locations, and search features. Query data can also be incomplete.
Compare page-level GSC data with GA4 landing page reports filtered to Organic Search: sessions, entrances, new users, assisted conversions, and revenue where relevant. Organic conversion rate = organic conversions / organic sessions. Content decay means traffic or clicks dropped over a set window, such as 90 days or year over year.

Backlinks and referring domains matter when they explain why a page can compete for hard keywords. Use ClickMinded’s SEO statistics for context, then calibrate targets against your own history before comparing against marketing benchmarks.
Impressions without qualified clicks point to a query, title, or intent problem. Branded growth can also hide weak non-branded acquisition.
Engagement metrics that show post-click usefulness
After the click, measure whether the page matched intent and helped the visitor choose a next step. Track engagement rate, average engagement time, scroll depth, video completions, table-of-contents clicks, internal link clicks, return visits, downloads, and comments when discussion matters.
Use simple formulas: Engagement rate = engaged sessions / sessions. Internal click-through rate = internal link clicks / content page views.
| Metric | What it can indicate | Watch out for |
|---|---|---|
| Engagement rate | Visitors stayed, clicked, converted, or met GA4’s engaged-session rules | Check GA4 setup before rewriting |
| Average engagement time | The page held attention | Tabs sit open, so time can lie |
| Scroll depth | Readers reached key sections | It does not prove understanding |
| Internal link CTR | Visitors wanted another related step | Better links do not always mean sales intent |
| Downloads, replies, return visits | The topic has ongoing value | Build follow-up content or nurture paths |
Short sessions can be fine when a page answers a narrow question quickly. For broader context, use ClickMinded’s content marketing statistics as a curated reference, then compare against your own baseline.
Conversion metrics that show whether the next step fits the page
Conversion metrics connect a page to a useful action: CTA clicks, form fills, email signups, trial starts, demo requests, subscriptions, add-to-cart events, and purchases. They show which pages need stronger CTAs, which offers match intent, and which topics bring in the wrong crowd.
| Metric | Formula |
|---|---|
| CTA CTR | CTA clicks / page views |
| Lead conversion rate | Leads / sessions or users |
| MQL rate | MQLs / leads |
| SQL rate | SQLs / MQLs or leads |
| Content-assisted conversion rate | Assisted conversions involving content / total conversions |
For SaaS, watch trial starts and demo requests. For ecommerce, track add-to-cart and purchases. For newsletters, email signup rate may matter most. For B2B, compare lead conversion rate with MQL and SQL rates. ClickMinded’s lead generation statistics and B2B marketing statistics can help before you benchmark your own funnel.
Gated downloads are not automatically qualified leads. Last-click reporting undervalues educational content. Forms break, UTMs drift, and CRM fields get messy.
Revenue metrics need attribution rules and a little humility
Once content reaches the CRM, the useful ROI metrics tie to pipeline quality, sales outcomes, and cost. Track content-sourced pipeline when the first known touch came from content. Track content-influenced pipeline when content appeared before opportunity creation or close.
| Metric | Formula |
|---|---|
| Pipeline influenced | Sum of open opportunity value where content was part of the journey |
| Content ROI | (content-attributed revenue - content cost) / content cost |
| Cost per qualified lead | Content campaign cost / qualified leads |
| CAC | Sales and marketing cost / new customers |
Watch opportunity creation rate, win rate by content cohort, revenue influenced, CAC by content channel, payback period, and LTV:CAC when the buying cycle is long enough for those ratios to mean anything. Content cost should include production, editing, design, subject matter expert time, tools, paid distribution, and agency or freelancer costs.

Attribution models answer different questions. First-touch shows what introduced the account. Last-touch shows what happened right before conversion. Multi-touch spreads credit across the journey. Self-reported attribution adds buyer memory, which helps, but it is not truth serum. Cohort views compare accounts that engaged with certain content against accounts that did not.
Influenced revenue is not owned revenue. Pipeline is not revenue. Attribution windows change the answer. Buying committees make person-level attribution incomplete. Use the model to make decisions, then compare it against your broader marketing metrics and internal marketing benchmarks.
Match the metric set to the business model
One KPI set will lie to you. High traffic helps an ad-funded publisher. It means much less for a niche services firm if the buying committee never arrives.
| Business model | Watch first | Measure later | Common trap |
|---|---|---|---|
| SaaS | Trials, demo clicks, activation | Retention, expansion, revenue | Counting dead signups |
| Ecommerce | SEO clicks, product views, carts | Purchases, repeat buys, margin | Optimizing only blog traffic |
| Services | Qualified inquiries, calls | Proposal value, close rate | Treating every form fill equally |
| Publisher/newsletter | Subscribers, engaged readers | Ads, sponsors, paid subs, retention | Chasing spikes |
| B2B lead gen | Account engagement, MQLs, SQLs | Opportunities, sales velocity | Ignoring buying committees |
For B2B, compare against B2B content marketing statistics and B2B marketing statistics.
Set a reporting rhythm that forces decisions
| Cadence | Check | Decision |
|---|---|---|
| Weekly | Indexing, clicks, key pages, conversions, campaign performance | Fix paths, pause weak promos, repair tracking |
| Monthly | Refresh needs, query movement, lead quality, assisted conversions, engagement | Update pages, shift briefs, improve CTAs |
| Quarterly | Pipeline, revenue influence, ROI, topic strategy, budget | Keep, cut, expand, or rebuild |

Assign owners by source: SEO owns Search Console and content inventory, analytics owns GA4, revenue ops owns CRM, and content owns interpretation. Keep raw data separate from commentary.
GA4 can be sampled, thresholded, or modeled. Search Console is aggregated, not a rank tracker. CRM attribution needs clean UTMs, lifecycle stages, and sales hygiene. Use marketing benchmarks for context, not goals.
FAQ: content marketing metrics, KPIs, and reporting questions
What are the most important content marketing metrics? Match the metric to the job: discovery needs impressions, clicks, rankings, and qualified organic sessions; engagement needs scroll, time, return visits, and next clicks; conversion needs leads, trials, demos, purchases, or subscriptions; revenue needs pipeline, closed revenue, CAC, and ROI.
Metrics vs. KPIs? Metrics diagnose. KPIs judge success. Clicks are a metric. Qualified demo requests can be a KPI.
Which SEO metrics matter? Queries, impressions, CTR, average position, indexed pages, organic sessions, assisted conversions, and refresh targets.
How do you measure ROI? (content-attributed revenue - content cost) / content cost. Label the attribution model.
Reporting checklist: define the content job, pick one outcome KPI, choose 3 to 5 diagnostic metrics, connect analytics to CRM, label attribution assumptions, and review on the right cadence.