
B2B content marketing statistics for 2026 planning
| Statistic | Best use | Confidence |
|---|---|---|
| CMI’s 2026 B2B Content and Marketing Trends report uses a survey of more than 1,000 B2B marketers. | Strategy, budget, and adoption baseline. | High. Recurring benchmark with a clear B2B sample. |
| In CMI’s 2025 outlook research, 46% of B2B marketers expected content marketing budgets to increase and 8% expected a decrease. | Budget planning and CFO conversations. | Medium. Verify against the primary CMI report before citing in board materials. |
| NetLine’s 2025 report uses 7.9 million first-party leads delivered in 2024. | Gated content, demand gen, and consumption planning. | High for syndication behavior. Lower for ungated or organic programs. |
| NetLine reported a 27% year-over-year surge in first-party leads delivered in 2024. | Modeling gated asset and syndication demand. | Medium. Platform data can reflect network mix and campaign volume. |
| The average content “Consumption Gap” reached 38.5 hours, up 7.3 hours year over year. | Lead follow-up timing and nurture assumptions. | High for gated syndication. Do not use it as a universal buyer-readiness benchmark. |
| 52% of decision-makers and 54% of C-suite executives spend an hour or more per week reading thought leadership. | Executive-content planning and SME investment. | Medium. Strong topic fit, but this citation is a secondary summary. |
| Among decision-makers who said thought leadership led them to research a new product or service, 60% began buying from or working with that organization. | Sales enablement and authority-building arguments. | Medium. Survey claim tied to a specific audience and behavior path. |
This guide sits between ClickMinded’s broader marketing statistics and B2B marketing statistics pages, and the more tactical content marketing statistics guide. It covers buyer behavior, budgets, gated content, and source-quality notes, not generic sales, advertising, or CRM benchmarks.
Confidence key: high means recurring benchmarks, transparent samples, or platform data with clear rules. Medium means usable data with bias risk, often from a vendor survey, sponsored study, or secondary summary. Low means older, unclear, non-B2B-specific, or hard-to-verify data.
Read the source before you use the benchmark
ClickMinded is curating and interpreting third-party data here. We do not own the CMI, HubSpot, NetLine, Demand Gen Report, Edelman, or LinkedIn datasets. Keep the source, year, audience, and caveat attached to any benchmark you copy into a deck.
| Source type | Best use | Weak spot | Confidence | Examples |
|---|---|---|---|---|
| Marketer surveys | Budgets, adoption, priorities | Revenue proof | Medium to high | CMI, HubSpot |
| Buyer surveys | Preferences, research behavior | Funnel performance | Medium | Demand Gen Report, Edelman, LinkedIn |
| Platform data | Real consumption or lead behavior | All-buyer claims | Medium to high inside that platform | NetLine |
| Vendor studies | Directional clues | Universal marketing benchmarks | Low to medium | Sponsored reports, vendor listicles |
Treat survey data as self-reported unless the methodology says otherwise. HubSpot reports that 93.7% of companies improved lead quality, but “lead quality” needs tying to marketing metrics like SQL rate, opportunity rate, and revenue per lead.
B2B content marketing statistics for planning, budget, and resourcing
Use this batch as input data, not performance proof. The latest CMI B2B benchmark research tracks documented strategy, budget direction, team structure, outsourcing, and resourcing challenges. For 2026 planning, that tells you how teams are setting up the work before traffic, leads, pipeline, or revenue enter the chat.

Documented content strategy is a maturity signal. If your team cannot explain audience, topics, channels, workflow, and measurement rules in one place, the plan is probably living in Slack archaeology. Just do not treat the document itself as performance proof. That needs separate content marketing metrics and revenue data.
Budget direction deserves the same separation. “We are spending more” can mean ambition, inflation, channel costs, or a headcount hole wearing a fake mustache. It does not prove the program works, and broad marketing benchmarks should not become a universal content spend target.
Team size and outsourcing are capacity inputs. Plan around production, editing, subject matter expert access, design, distribution, and reporting. Outsourcing can be a smart way for lean teams to buy specialized help.
The planning move for 2026 is simple: name what gets cut, paused, or outsourced when priorities exceed capacity. Resourcing challenges answer a different question than lead generation or conversion benchmarks.
Format popularity does not prove lead quality
B2B teams create educational, proof, and conversion assets, but the benchmarks do not measure the same thing. CMI B2B research, Demand Gen Report, and NetLine consumption reports are all useful, as long as creation, consumption, and lead capture stay in separate buckets.
| Format | Common benchmark use | Watch-out |
|---|---|---|
| Blog posts and SEO pages | Reach, education, organic demand | Popularity can hide weak buying intent |
| Research reports and white papers | Lead capture, authority, sales enablement | Form fills can include students, vendors, and low-fit contacts |
| Webinars | Mid-funnel education, attendee intent | Registrants and attendees are different audiences |
| Case studies | Proof for evaluation teams | Hard to benchmark without deal-stage context |
| Templates and tools | Practical demand capture | High volume can mean low urgency |
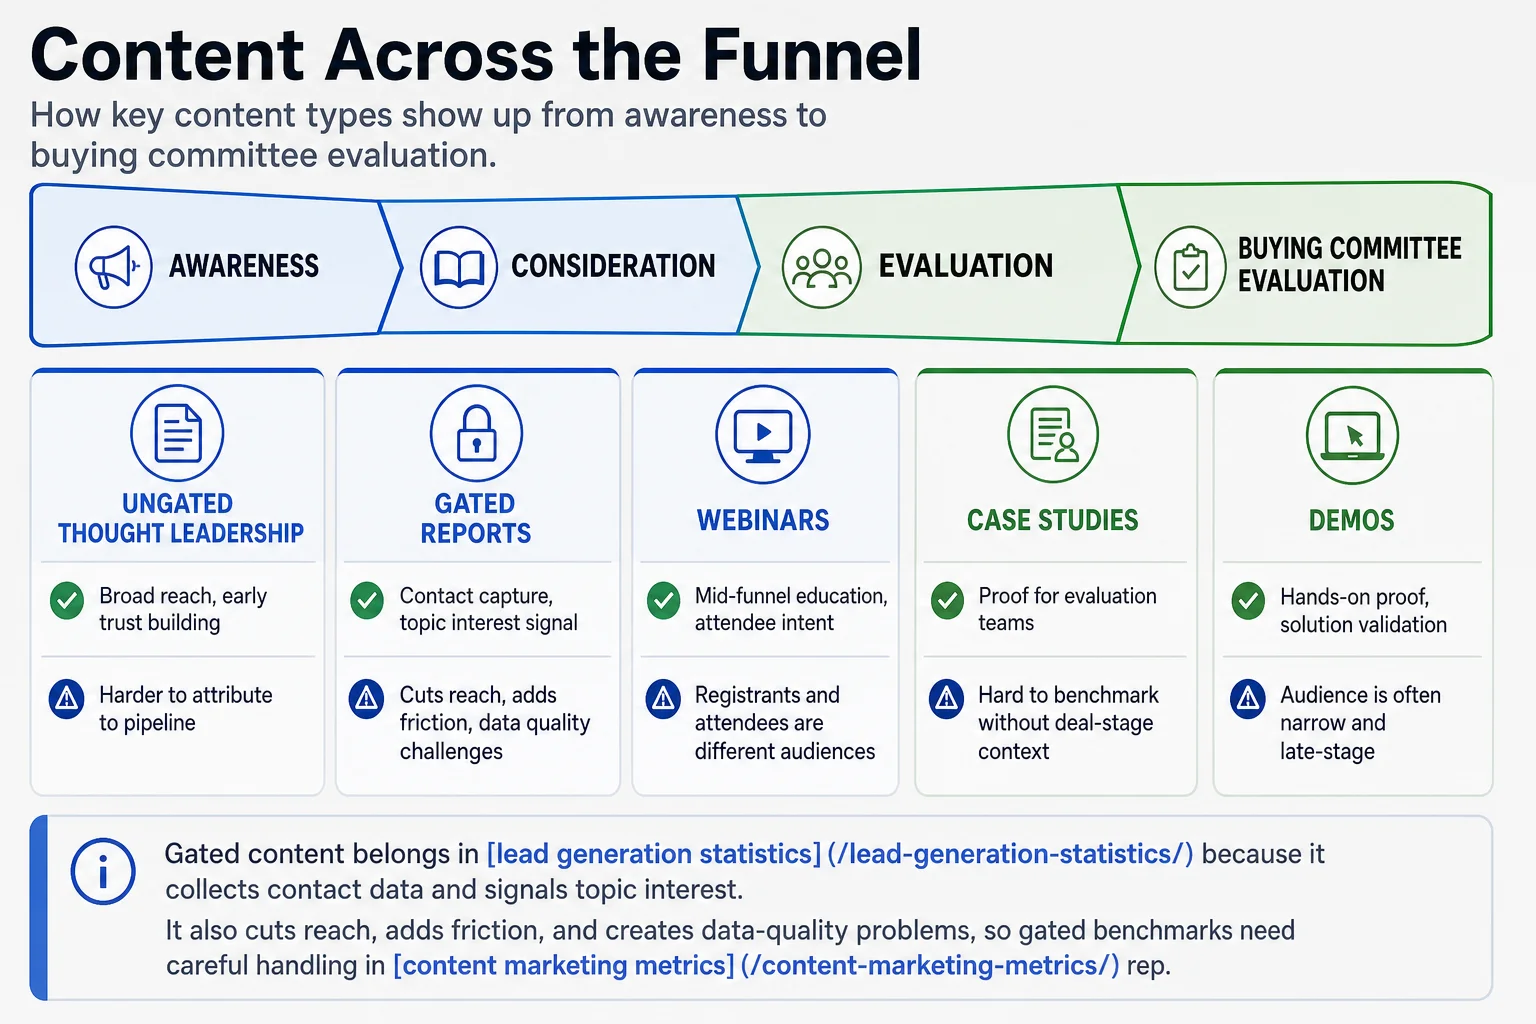
Gated content belongs in lead generation statistics because it collects contact data and signals topic interest. It also cuts reach, adds friction, and creates data-quality problems, so gated benchmarks need careful handling in content marketing metrics reporting. Sample source, form length, asset type, time window, and follow-up quality can all change the number you are looking at.
What buyers read to reduce risk before sales gets involved
Buyers use content to answer decision questions before they accept a sales conversation. The useful lens is risk: financial risk, implementation risk, career risk, and consensus risk. Broad B2B marketing statistics can show channel behavior, but content behavior needs a tighter read.
| Buyer decision stage | Content evidence that helps |
|---|---|
| Research | Educational articles, trend reports, problem explainers |
| Shortlisting | Comparison pages, category guides, analyst-style summaries |
| Internal alignment | ROI models, business-case decks, executive briefs |
| Vendor evaluation | Case studies, implementation pages, security docs, pricing guidance |
| Final validation | References, proof of adoption, migration details |
Demand Gen Report’s content preference research, NetLine’s consumption data, and Edelman and LinkedIn’s thought leadership research are useful here, but they measure different things: self-reported preference, platform consumption, and perceived authority. Treat them as directional evidence, then validate with your own content marketing metrics, especially assisted pipeline, sales usage, and deal-stage engagement.
AI and distribution stats belong in the workflow bucket
AI belongs in the production conversation before the performance conversation. Recent CMI B2B benchmark research and HubSpot State of Marketing research both treat AI as a major workflow topic. For B2B teams, the useful question is where it increases throughput, and where it weakens trust.
| Workflow use case | Cited adoption or trend | Strategic implication | Caveat |
|---|---|---|---|
| Drafting and repurposing | AI appears prominently in recent research from CMI and HubSpot | Use it for outlines, variants, summaries, and sales enablement spinouts | Same-source sameness is a real risk |
| Research assistance | B2B teams face pressure to publish more with limited resources, a recurring theme in CMI benchmark reporting | Speed up briefing and source collection | Verify every claim, quote, and number |
| SEO and distribution | Websites, blogs, search, social, email, webinars, and paid promotion remain common B2B surfaces in HubSpot’s trend reporting | Plan distribution before writing | Benchmarks swing by topic, funnel stage, brand demand, and sales cycle |
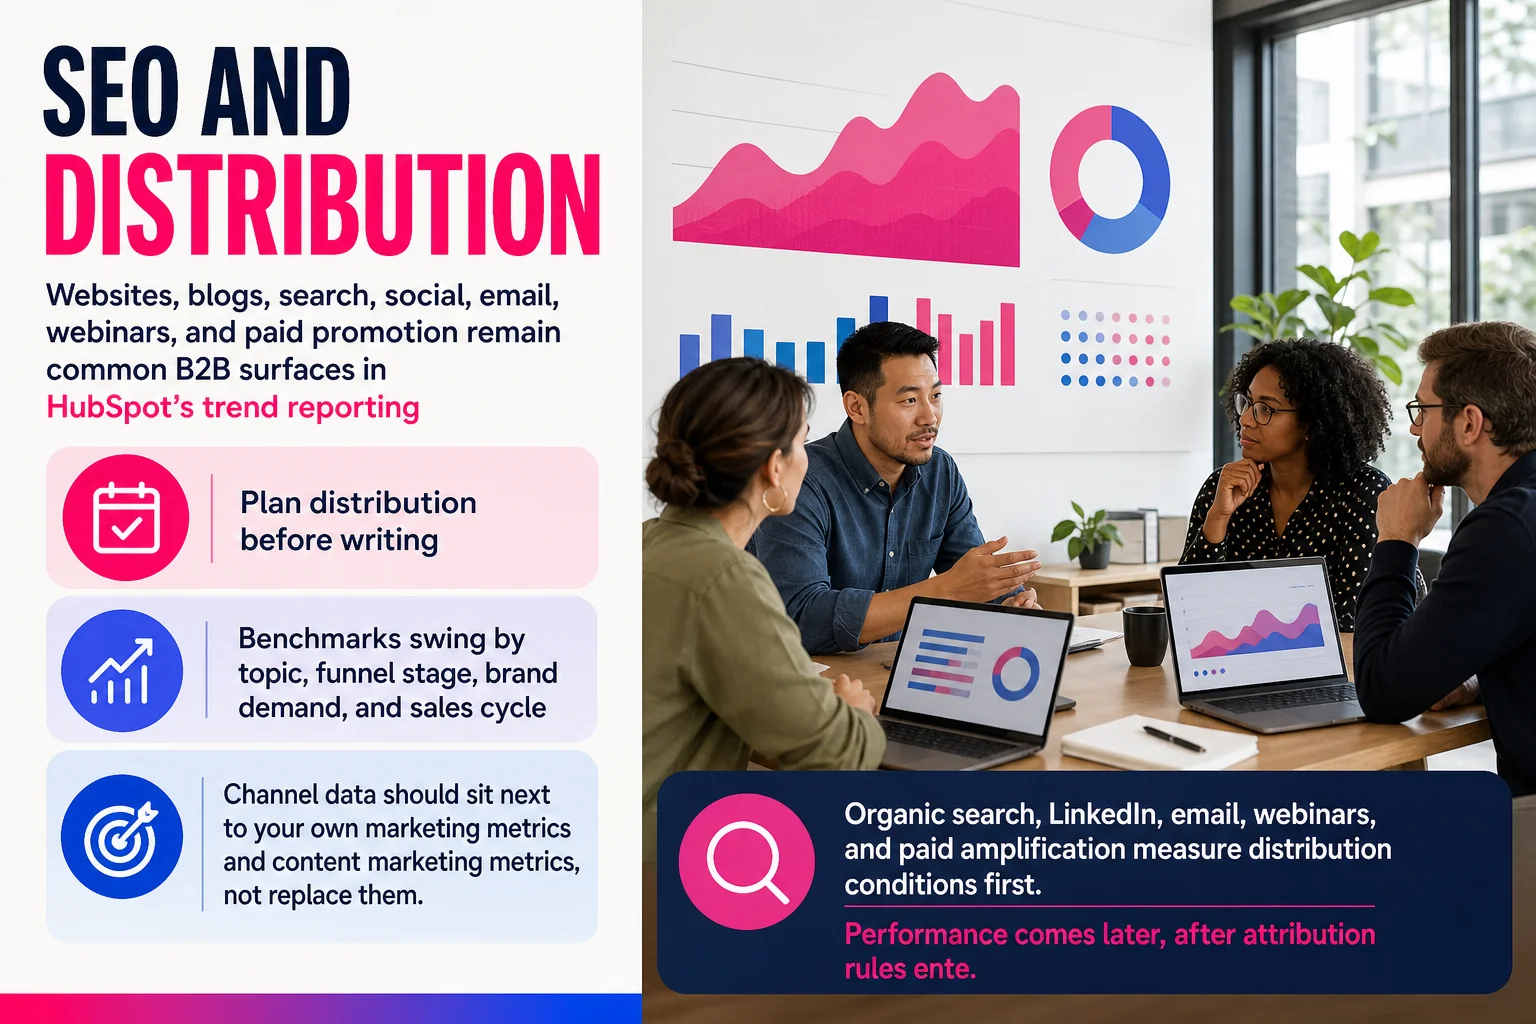
Channel data should sit next to your own marketing metrics and content marketing metrics, not replace them. Organic search, LinkedIn, email, webinars, and paid amplification measure distribution conditions first. Performance comes later, after attribution rules enter the room.
Measure content performance without forcing bad benchmark comparisons
Public benchmarks are directional. Use them for context, then report against your own baseline in marketing metrics, content marketing metrics, and marketing benchmarks.
| Metric | Type | Use it for |
|---|---|---|
| Organic traffic to content | Content performance | Reach and topic demand |
| Engaged sessions, scroll depth, return visits | Content performance | Quality signals |
| Content-assisted conversions | Content performance, with caveats | Pipeline influence |
| Form fills from gated assets | Content and lead gen | Offer strength and audience fit |
| MQLs, SQLs, pipeline, revenue | Broader marketing and sales | Business impact, with shared ownership |
B2B attribution gets messy because buyers read, leave, compare, forward links, join calls, and bring in other people. Report content as influence plus evidence, not a magic revenue source.
Common questions before you put these stats in a deck
What are the most useful B2B content marketing statistics for 2026? Use adoption, budget, format, gated content, buyer behavior, AI, distribution, and measurement data together. CMI’s benchmark research, NetLine’s consumption reporting, and Edelman and LinkedIn’s thought leadership research are solid starting points.
How are benchmarks different from metrics? Benchmarks compare outside data. Metrics measure your own performance.
Are gated content statistics still useful? Yes, for offer planning and lead generation statistics, not universal targets.
Which formats perform best? Match format to buying stage, then check your analytics.
Use B2B marketing statistics for context, content marketing statistics and marketing statistics for comparison, and internal analytics for targets.