
Good SMS benchmarks start with the right comparison group
SMS marketing benchmarks are useful only when you know what population, message type, and metric definition produced them. A decent ecommerce promo, an abandoned cart automation, a service reminder, and a support-style two-way text should not be graded against the same average. That is how teams end up celebrating a number that looks good in a slide deck and quietly hurts revenue, consent quality, or deliverability.
For a practical starting point, Klaviyo’s public SMS and MMS campaign benchmarks list “good” campaign performance at an 8.9% to 14.5% click rate, 1.0% to 2.0% placed order rate, $0.66 to $2.41 revenue per recipient, and 0.6% to 1.4% unsubscribe rate. Those are useful ranges, especially because Klaviyo’s benchmark page says its 2026 SMS data is based on over 183,000 customers. They are still vendor benchmarks from a specific customer base, with ecommerce weight and platform-specific reporting rules.
ClickMinded is compiling and interpreting third-party benchmark data here. We are not claiming to own the underlying SMS benchmark dataset. If you want the broader benchmark hub, use our marketing benchmarks page. If you want the stats companion to this guide, see our sms marketing statistics page.
A high open rate is not the same as a healthy SMS program. SMS is visible because it lands close to someone’s lock screen, which is exactly why weak targeting, over-sending, vague consent, and weak offers get punished quickly. The better benchmark set includes click rate, conversion or order rate, revenue per recipient, unsubscribe or opt-out rate, delivery rate, reply rate, list growth, consent coverage, and carrier filtering or compliance rejection where the platform reports it.
Treat “good” as a range for a comparable cohort, not a universal badge. If your click rate is average but opt-outs are high, the program has a list-health problem. If revenue per recipient is strong but deliverability is slipping, the next campaign may not reach the same audience. SMS benchmarks should help you decide what to fix, not give you one number to report out of context.

SMS marketing benchmark table: practical ranges and caveats
Use this table as a planning aid, not a scoreboard. Public SMS benchmarks skew ecommerce and platform-specific, especially Klaviyo’s data. For reminders, B2B follow-ups, support texts, replenishment flows, and mixed consent sources, your best benchmark is usually your own trailing 30 to 90 day baseline.
| Metric | Useful benchmark or planning range | Source context | Caveat |
|---|---|---|---|
| Click rate | Ecommerce campaigns: 8.9% to 14.5%. Flow SMS: near 10% on average, top performers above 16%. | Klaviyo campaign and flow benchmarks, ecommerce-heavy customer base. | Offer, list source, message type, and denominator all change the number. |
| Conversion or order rate | Ecommerce campaigns: 1.0% to 2.0% placed order rate. For other use cases, track internally. | Klaviyo SMS and MMS benchmark docs. | ”Conversion” can mean order, appointment, reply, form fill, or attributed purchase. The event and denominator have to match before the benchmark is useful. |
| Revenue per recipient | Ecommerce campaigns: $0.66 to $2.41 RPR. Top 10% SMS flows: above $5 RPR. | Klaviyo reports flows are 7.6% of sends and 45.2% of SMS revenue. | RPR depends on attribution window, price, discounting, and buyer suppression. |
| Unsubscribe or opt-out rate | Ecommerce campaigns: 0.6% to 1.4% unsubscribe rate. | Klaviyo SMS and MMS benchmark docs. | Watch spikes by send. A tolerable flash-sale opt-out rate may be awful for a welcome flow. |
| Deliverability or delivery rate | Track internally. | Public benchmarks rarely publish comparable delivery rates across carriers, countries, and sender types. | Carrier filtering, registration, country, list quality, and compliance setup all matter. |
| Reply rate | Track internally. | Ecommerce benchmarks usually focus on clicks, orders, revenue, and unsubscribes. | High replies can help concierge sales, but negative replies can create support load or complaint risk. |
| List growth | Synthesized planning range: compare opt-in growth against traffic, signup exposure, and unsubscribe volume. | Vendor benchmarks focus more on message performance than acquisition. | Paid traffic, popup incentives, checkout opt-ins, and loyalty programs produce different list quality. |
| Consent coverage | Track internally. | Consent is usually managed inside your SMS platform or CRM. | Segment by explicit SMS consent, source, country, age of consent, and proof of opt-in. |
| Compliance rejection or carrier filtering | Track internally. | Public data rarely gives clean rejection or filtering rates across carriers and sender types. | Watch failed sends, filtered messages, registration issues, SHAFT rejections, and approval problems. |
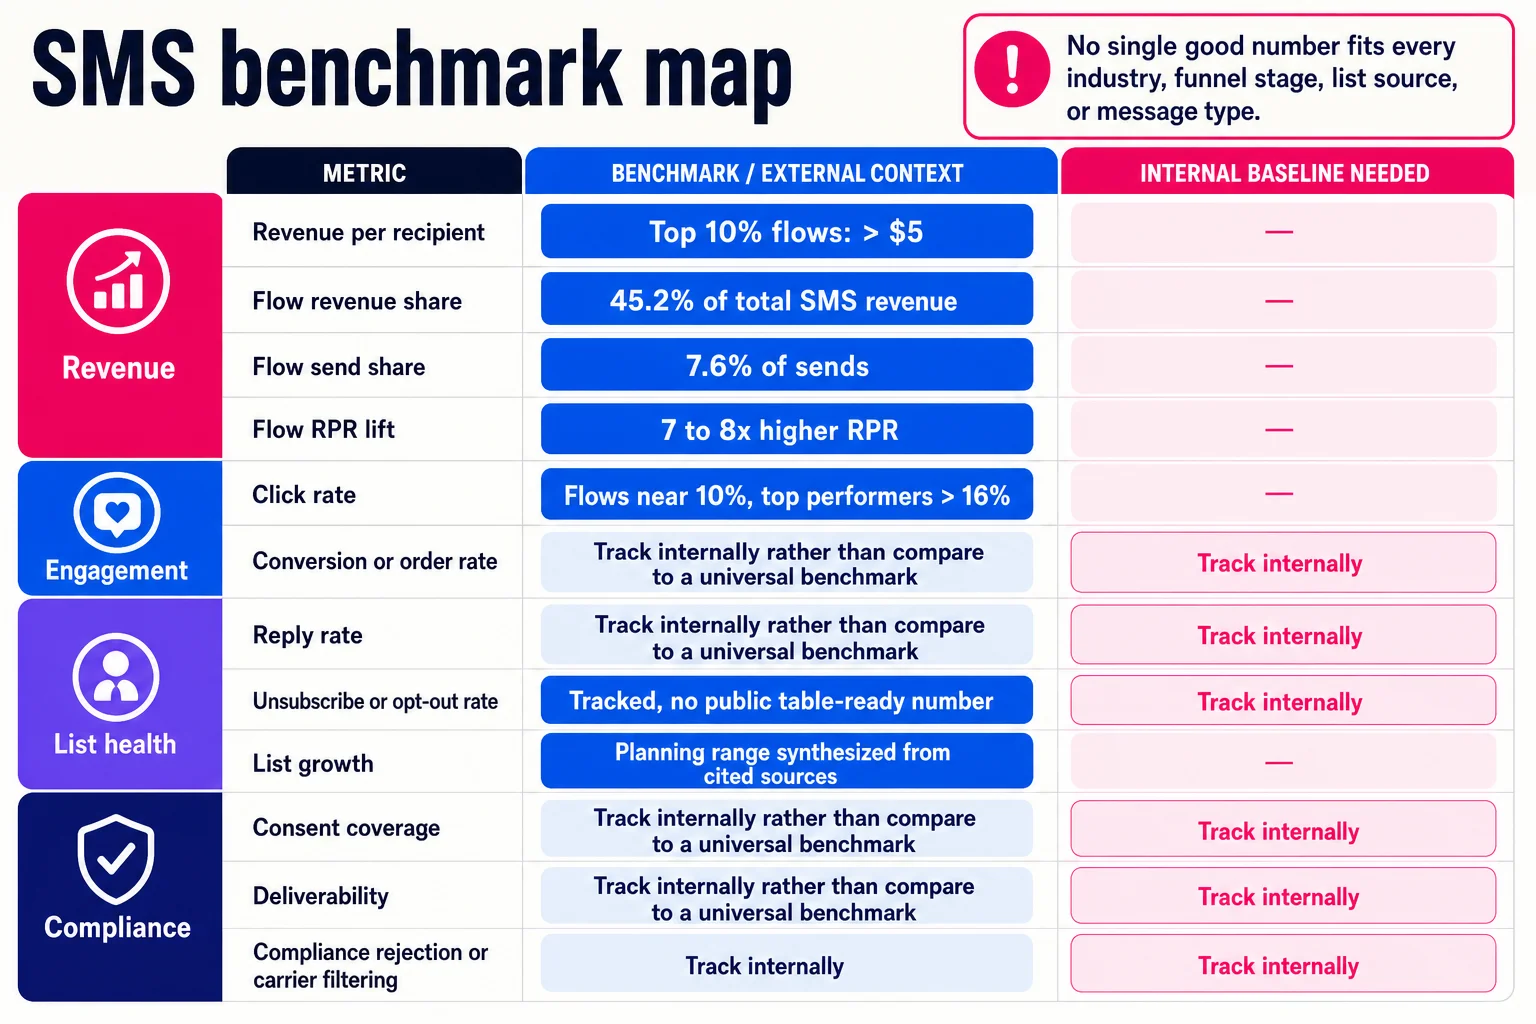
Use sourced ranges for ecommerce promotional SMS and flows, then build your own baseline for anything with a different job. A cart reminder, post-purchase update, sales appointment reminder, and support text should not share one target. For a broader KPI vocabulary, pair this table with our guides to marketing metrics and marketing statistics.
Define the metric before you compare it
Before you ask whether your number is good, ask whether it is the same number. SMS benchmarks become hard to compare when one platform reports clicks per delivered message, another reports clicks per sent message, and a third uses unique recipients. For a broader KPI formula refresher, keep the marketing metrics guide open while you compare sources.
For SMS, Klaviyo defines click rate as unique clickers divided by people who received the SMS or MMS. That is different from total clicks divided by sent messages. Repeat clickers inflate a total-click formula, while failed delivery changes the denominator if you use sent instead of delivered.
Conversion rate has the same trap. Klaviyo’s SMS benchmark conversion metric maps to placed order rate, meaning orders attributed within the channel attribution window divided by unique recipients. Orders per click will look much higher because it ignores everyone who saw the message and did nothing. Useful metric, different question.
Revenue per recipient is usually the cleanest commercial SMS metric, but only if the formula matches. Klaviyo defines it as attributed revenue divided by the people who received the message. Revenue per sent, revenue per delivered, and revenue per subscribed contact can all tell different stories. Klaviyo labels $2.42 and above as “great” revenue per recipient, but that benchmark only travels when your attribution window and denominator match.
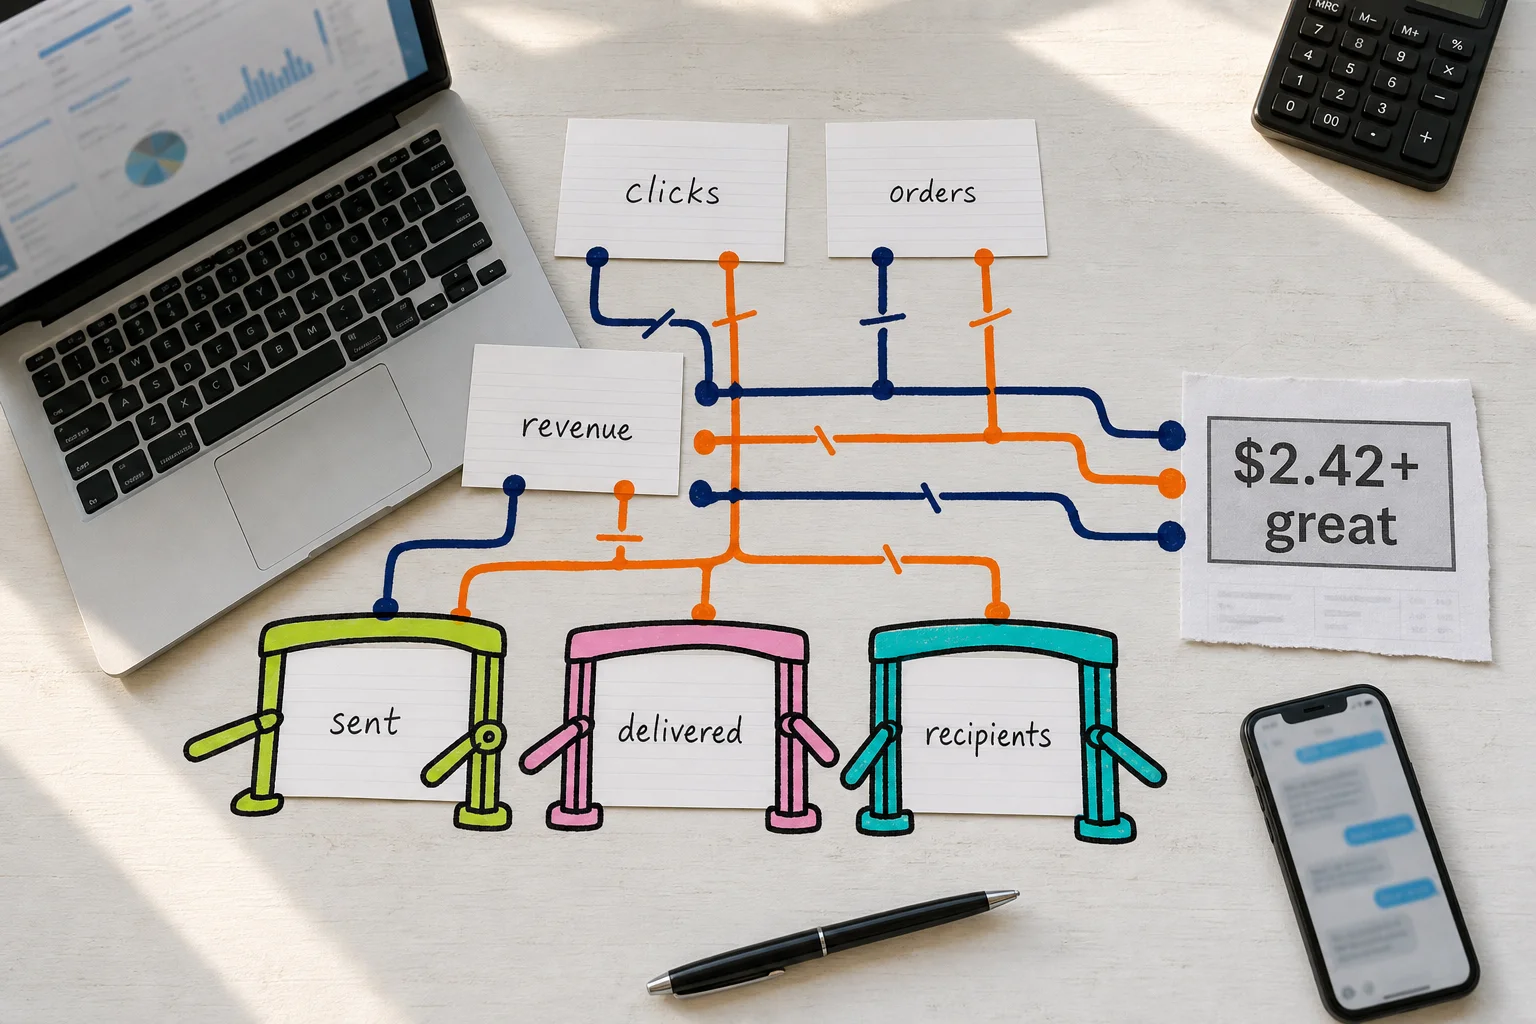
Opt-out rate needs the same treatment. Campaign opt-out rate usually means unsubscribes after a message divided by recipients. Program-level opt-out rate looks at churn over time. A campaign can look fine while the SMS list shrinks because unsubscribes outpace new consented subscribers.
Delivered also needs a definition. Accepted, delivered, failed, filtered, and blocked are separate events in many systems. Klaviyo warns that higher-than-average SMS unsubscribe rates can lead to carrier limitations or blocking, so deliverability belongs next to unsubscribe rate in your reporting.
A few other metrics need labels before they become benchmarks. Reply rate can mean sales intent, support demand, complaints, keyword opt-ins, or creative spellings of “STOP.” List growth can mean gross opt-ins or net growth after unsubscribes. Consent coverage means valid SMS permission, ideally segmented by source, country, proof of opt-in, and consent age. Compliance rejection should be tracked separately from normal delivery failure so the team knows whether the issue is technical, list quality, or compliance.
Benchmarks change by message type: campaigns, flows, carts, post-purchase, reminders, and support
The same SMS click rate can mean very different things depending on why someone got the message. A shopper who abandoned checkout 20 minutes ago has a different intent level than someone getting a weekend sale blast, a delivery update, or a support follow-up.
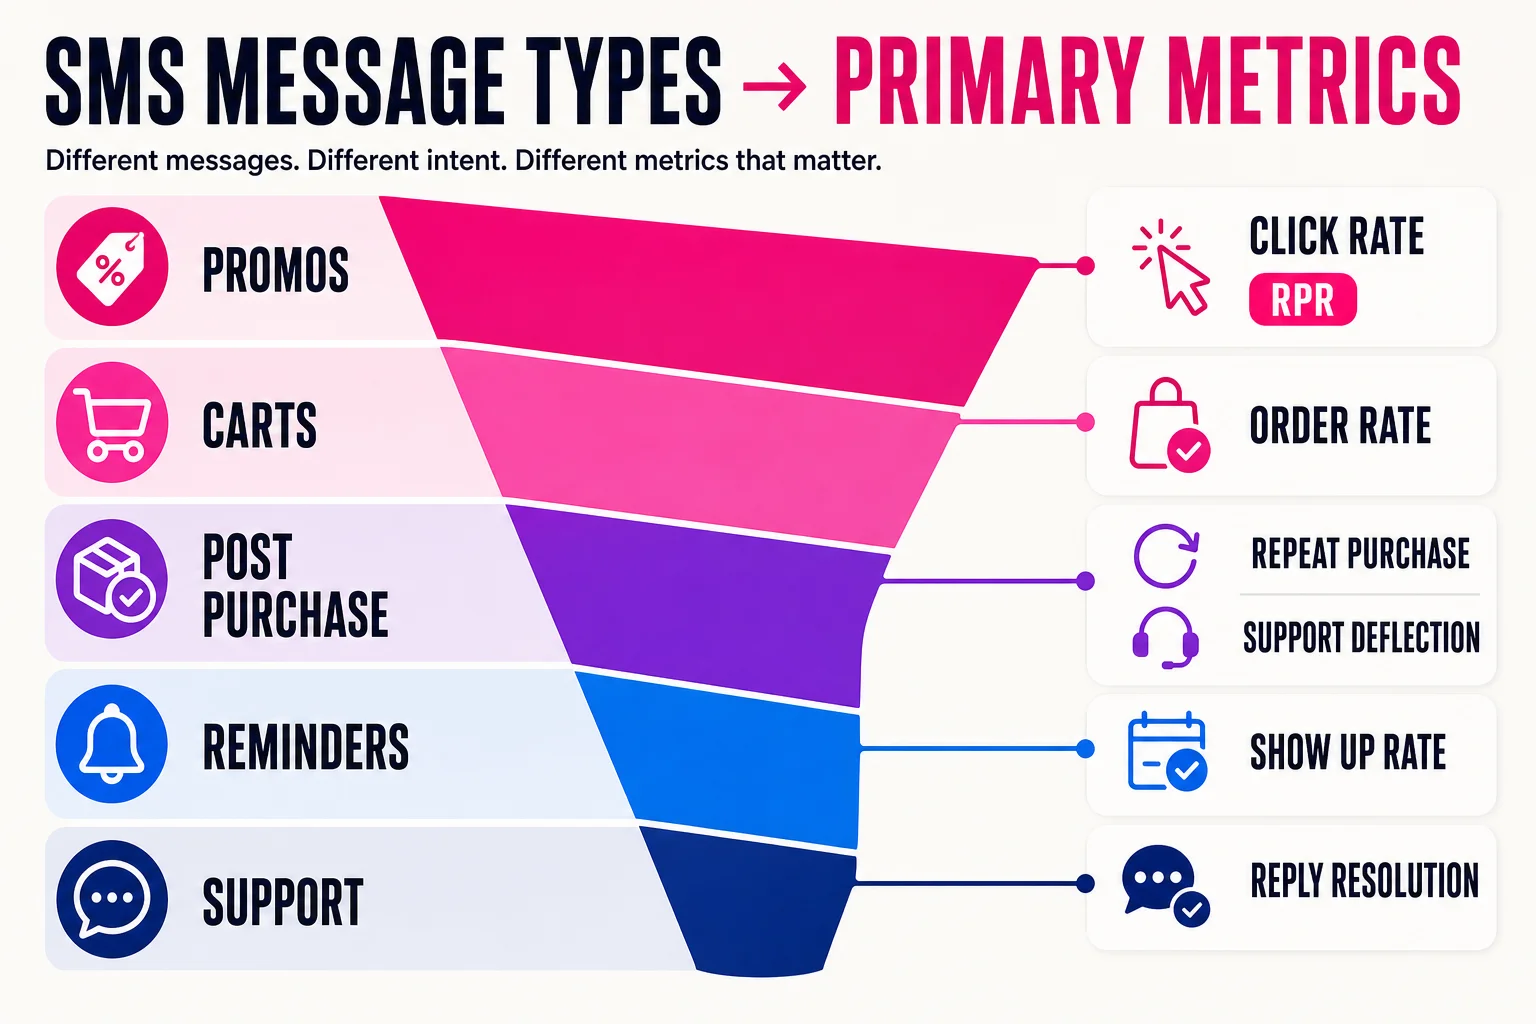
For ecommerce promos, judge click rate and revenue per recipient together. Broadcasts deserve tougher opt-out scrutiny because the audience is broader and your “20% off” text is competing inside the same notification inbox as every other brand. A high click rate with weak RPR can mean curiosity, poor offer fit, a landing page mismatch, or discount shoppers who never planned to buy. A decent RPR with rising opt-outs may still be a poor tradeoff if the campaign burns consent faster than the list grows.
Automated flows should usually beat broad campaigns on conversion and RPR because the trigger carries intent. Email benchmark analyses often show flows outperforming campaigns on revenue per recipient, but do not copy that multiplier into SMS targets unless the source publishes SMS-specific flow data. Use the pattern, then validate it inside your own account.
Abandoned cart and checkout messages deserve higher order-rate expectations than broad promos. The shopper already showed product intent, so weak conversion is a diagnostic signal. Klaviyo reports abandoned cart flows with an average placed order rate of 3.33% and average revenue per recipient of $3.65, though that is ecommerce automation performance, not a universal SMS-only benchmark. Klaviyo also documents a common abandoned cart sequence of 3 emails with the first send 2 to 4 hours after checkout, which is useful timing context. Test SMS timing carefully because the channel feels more interruptive.
Post-purchase SMS may produce lower immediate revenue than cart recovery when it handles delivery, education, reviews, replenishment, or support. Measure repeat purchase rate, support deflection, review completion, reply quality, and unsubscribe rate. If the message reduces “where is my order” tickets, RPR undercounts the win.
For B2B, appointments, and service reminders, optimize for show-up rate, confirmation rate, reply rate, or booked-call completion. Support SMS belongs on resolution rate, response time, customer satisfaction, escalation rate, and opt-outs. A dashboard that treats every non-click as failure will punish messages built to get replies.
Compare benchmarks only when the cohort matches your list
A third-party SMS benchmark is useful only if the cohort looks like your program. Ecommerce promo data should not set the target for B2B appointment reminders. A new subscriber welcome flow should not be compared with a list of long-time customers who have already bought three times. VIP buyers, discount-only subscribers, paid-social-acquired opt-ins, and checkout opt-ins all behave differently because they came in with different intent.
Use this quick comparability check before you borrow any number:
Was the benchmark measured on the same platform, region, industry, message type, consent source, and attribution window?
Region and carrier setup matter too. US programs using short codes, 10DLC, or toll-free numbers can face different deliverability and filtering conditions than non-US programs. Seasonal campaigns also distort averages. A Black Friday discount blast, a January replenishment nudge, and a July service reminder do not belong in one clean bucket just because they are all SMS.
Klaviyo’s public 2026 SMS benchmark page reports metrics from over 183,000 Klaviyo customers, which is useful scale, but the public page does not disclose the full industry weighting, region splits, measurement window, or whether reported values are means or medians. Treat broad SMS marketing benchmarks like cross-channel benchmarks on marketing benchmarks and marketing statistics: good for orientation, risky as a target without cohort fit.
How to judge SMS benchmark sources without getting misled
Vendor SMS benchmarks can help, especially when they come from large sending datasets or platform dashboards. They also reflect that vendor’s customers, product defaults, attribution model, and deliverability setup. A Postscript ecommerce cohort, a Klaviyo retail dashboard, and a broad SMS stats roundup may all be valid, but they may answer different questions.
Before trusting a benchmark, check whether it explains:
| Check | What to look for |
|---|---|
| Sample size | Brands, messages, recipients, or campaigns measured |
| Date | Report year and measurement window |
| Industry mix | Ecommerce, services, B2B, healthcare, local, or mixed |
| Geography | Country, carriers, and compliance rules |
| Platform bias | Whether results reflect one vendor’s customers |
| Metric definitions | CTR, conversion, order rate, RPR, opt-outs |
| Attribution window | Same-session, 24-hour, 5-day, 30-day, or default |
| Filtering | Whether bot clicks, failed sends, and spam are removed |
| Consent quality | Checkout, pop-up, imported list, or explicit campaign consent |
| Message type | Promos, flows, reminders, and transactional texts separated |
Treat the familiar 98% open-rate claim carefully. Many pages cite SMS open rates around 90% to 98%, and Klaviyo reports around 95%. Visibility is real, but open rate is weak for planning unless the source explains the method and cohort. For decisions, favor click rate, orders, revenue per recipient, opt-outs, replies, and filtering data with clear definitions.
Turn benchmarks into targets and next actions
Use SMS marketing benchmarks as planning ranges, then tighten them with your own data from the last 90 days.
- Pick the message type: promo, cart recovery, post-purchase, reminder, support, or another flow.
- Define the denominator and attribution window. Use placed-order rate per recipient when comparing channels.
- Choose a comparable cohort by industry, audience intent, list source, and funnel stage.
- Set a target range. For example, a promo campaign might use 8.9% to 14.5% CTR as a good planning band, while mature flows may aim toward stronger RPR, with top SMS flows exceeding $5 RPR.
- Watch guardrails: opt-outs, deliverability, replies, complaints, and carrier filtering.
- Diagnose misses by list source, offer, timing, consent quality, and landing page.
- Re-benchmark monthly for active programs, quarterly for slower lists.

For more planning context, pair this with broader marketing benchmarks, marketing metrics, marketing statistics, and our SMS marketing statistics. The strongest SMS program generates profitable action while preserving consent, deliverability, and trust.